Saros 13

Panorama of Solar Eclipses of Saros 13

Fred Espenak

Introduction

A solar eclipse occurs whenever the Moon's shadow passes across Earth's surface. At least two solar eclipses and as many as five occur every year.

The periodicity and recurrence of solar eclipses is governed by the Saros cycle, a period of approximately 6,585.3 days (18 years 11 days 8 hours). When two eclipses are separated by a period of one Saros, they share a very similar geometry. The two eclipses occur at the same node with the Moon at nearly the same distance from Earth and the same time of year due to a harmonic in three cycles of the Moon's orbit. Thus, the Saros is useful for organizing eclipses into families or series. Each series typically lasts 12 to 13 centuries and contains 70 or more eclipses. Every saros series begins with a number of partial eclipses near one of Earth's polar regions. The series will then produce several dozen central eclipses before ending with a group of partial eclipses near the opposite pole. For more information, see Periodicity of Solar Eclipses.

Panorama of Solar Eclipses of Saros 13

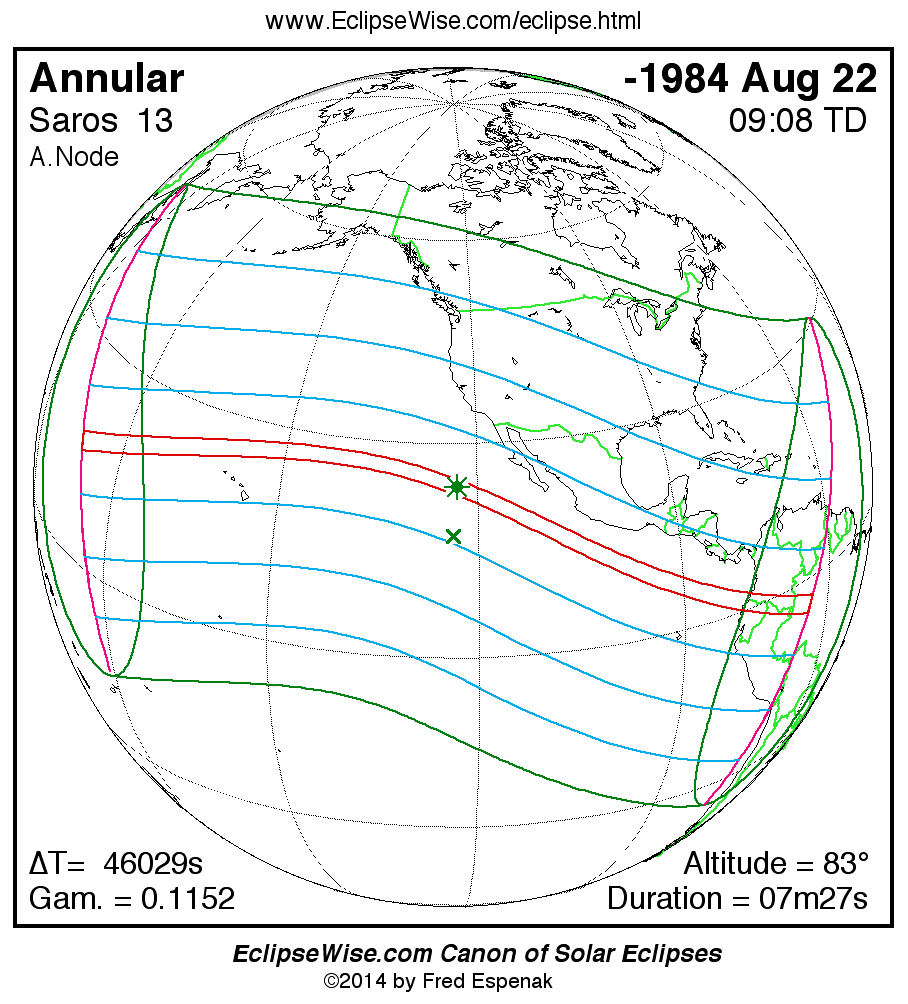
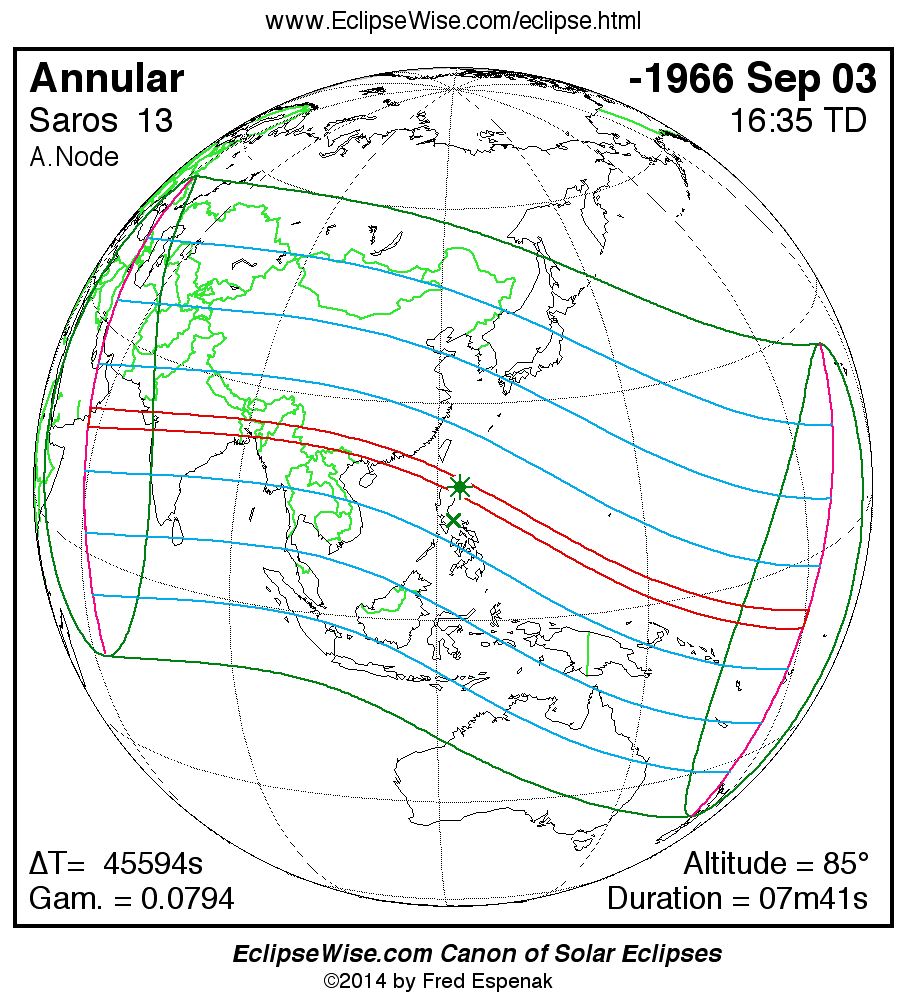
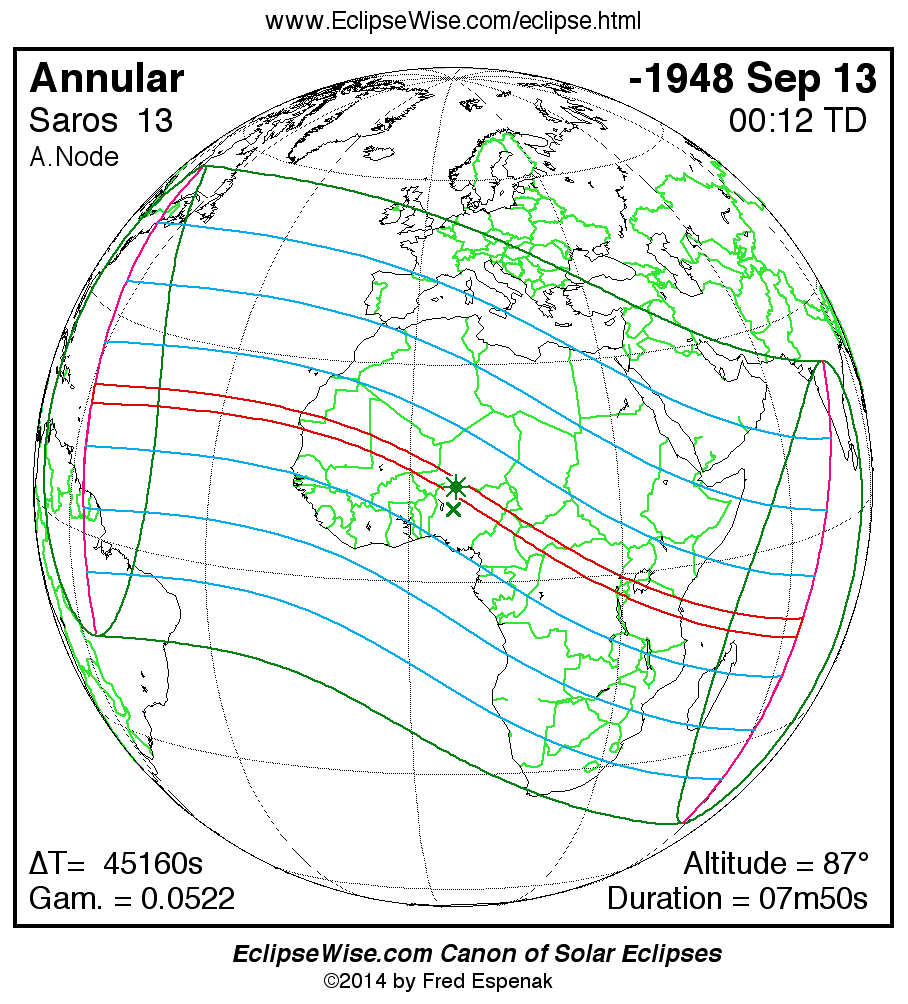
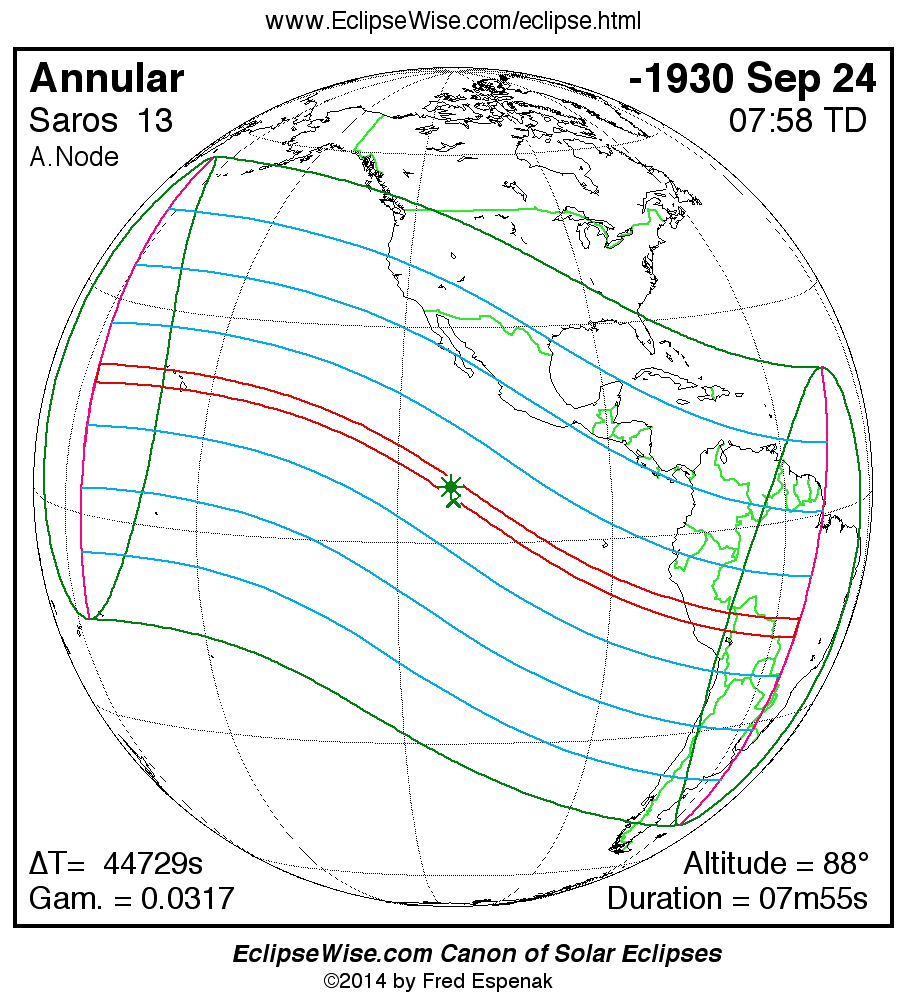
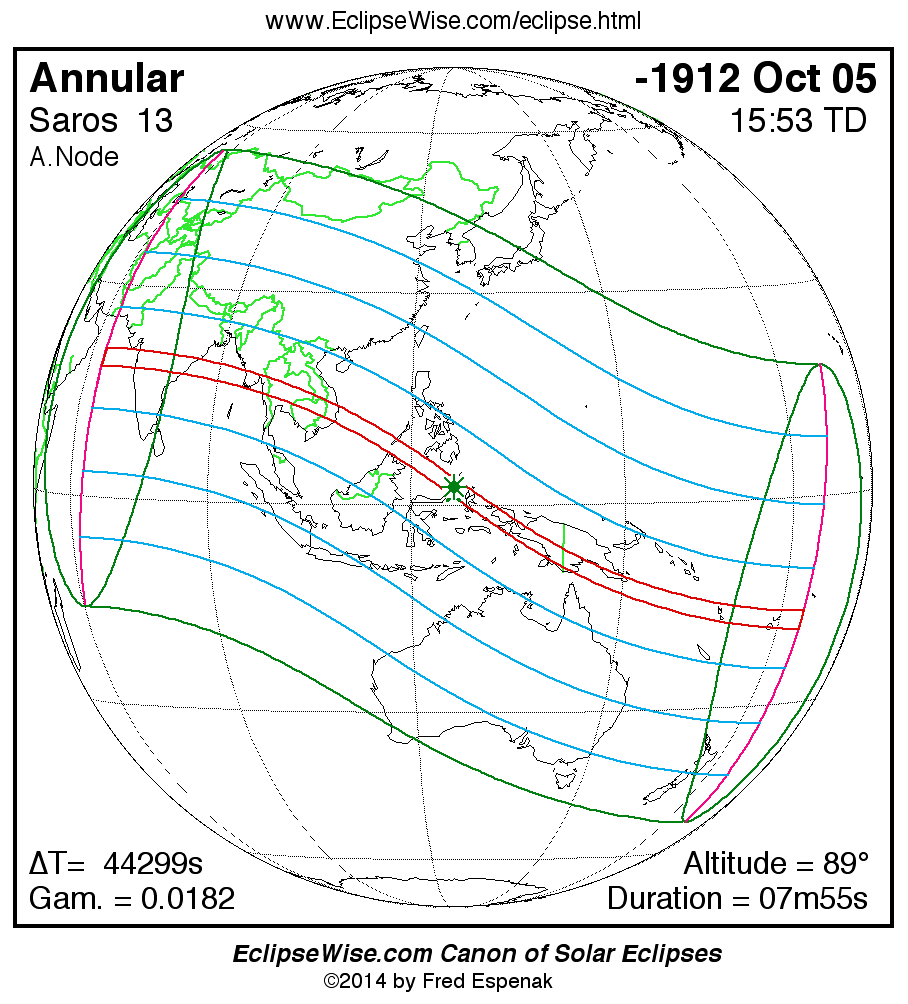
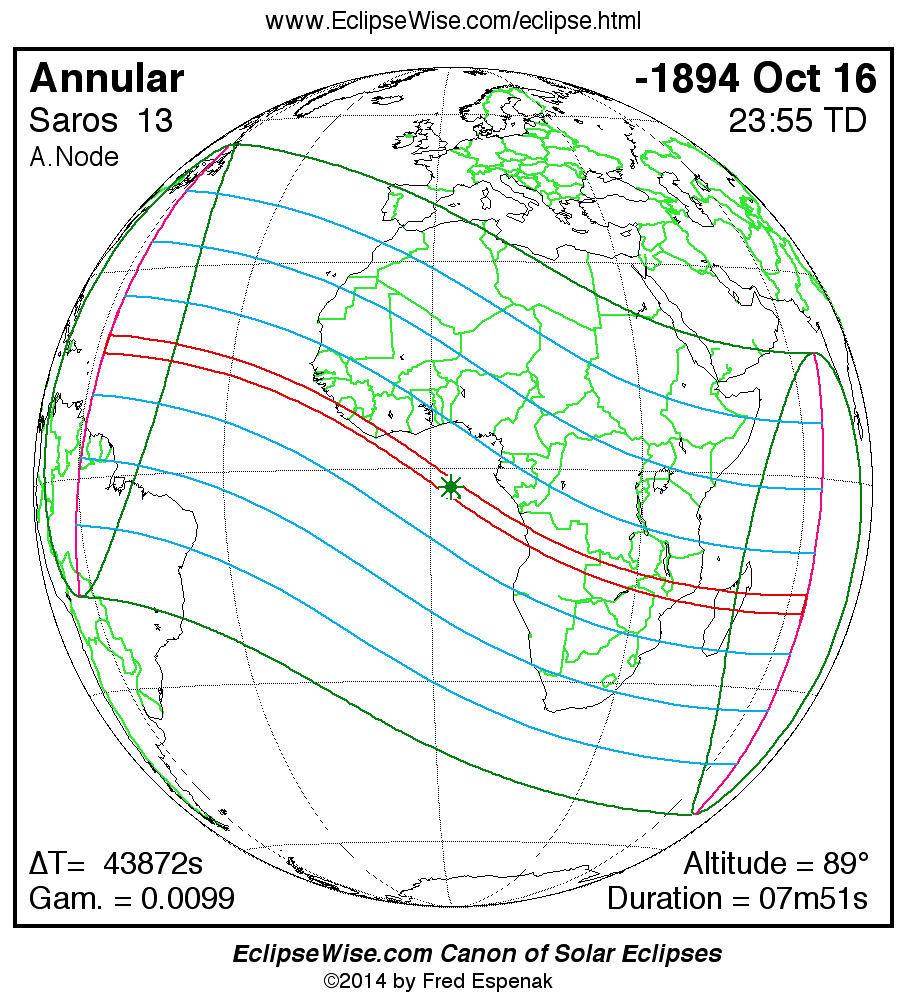
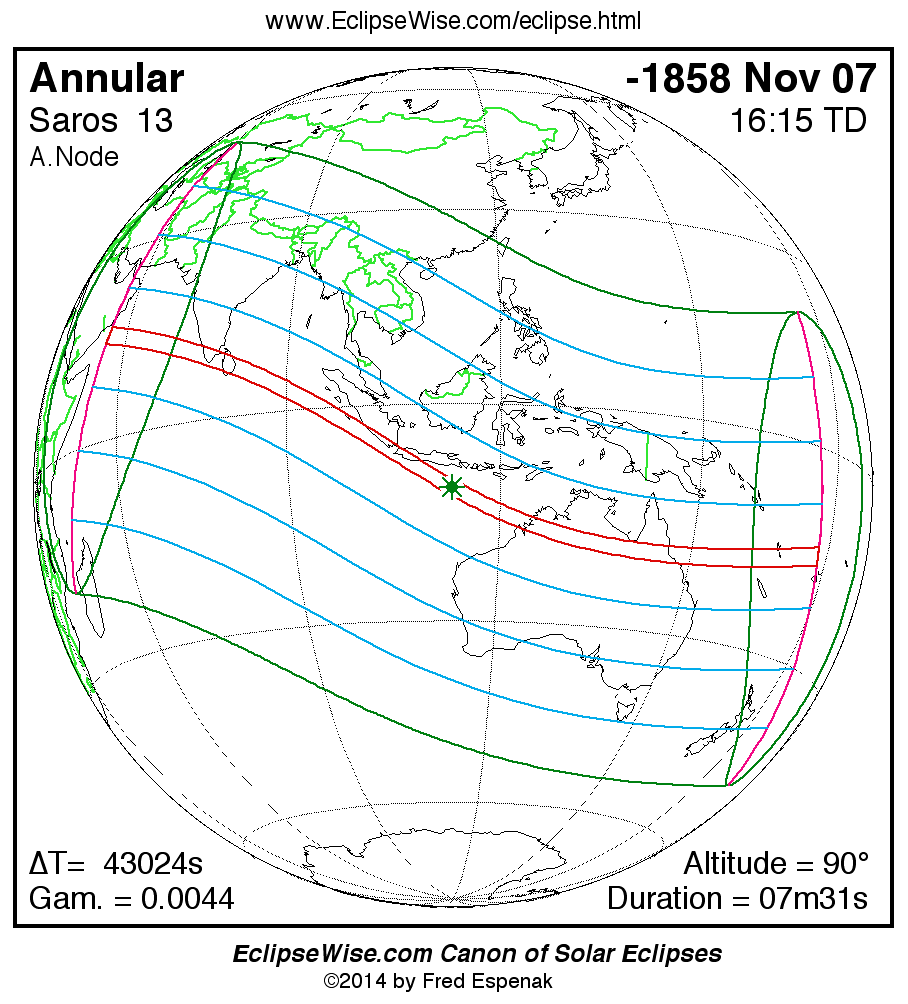
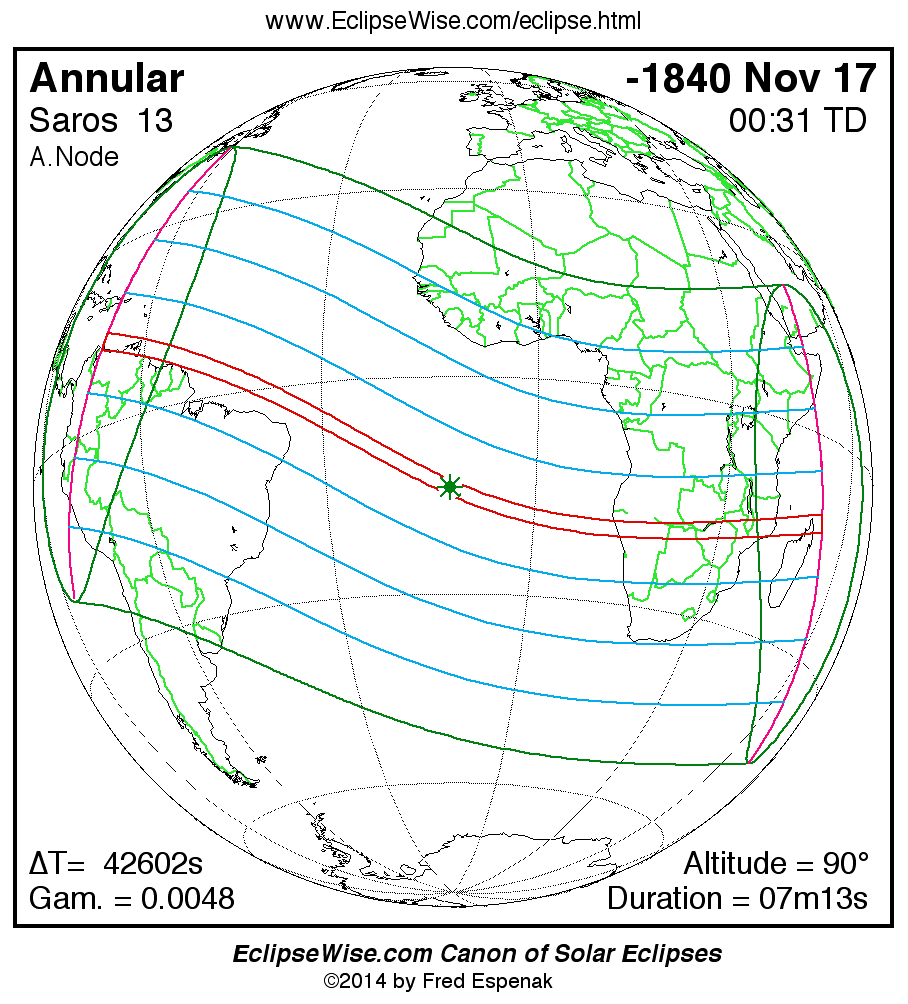
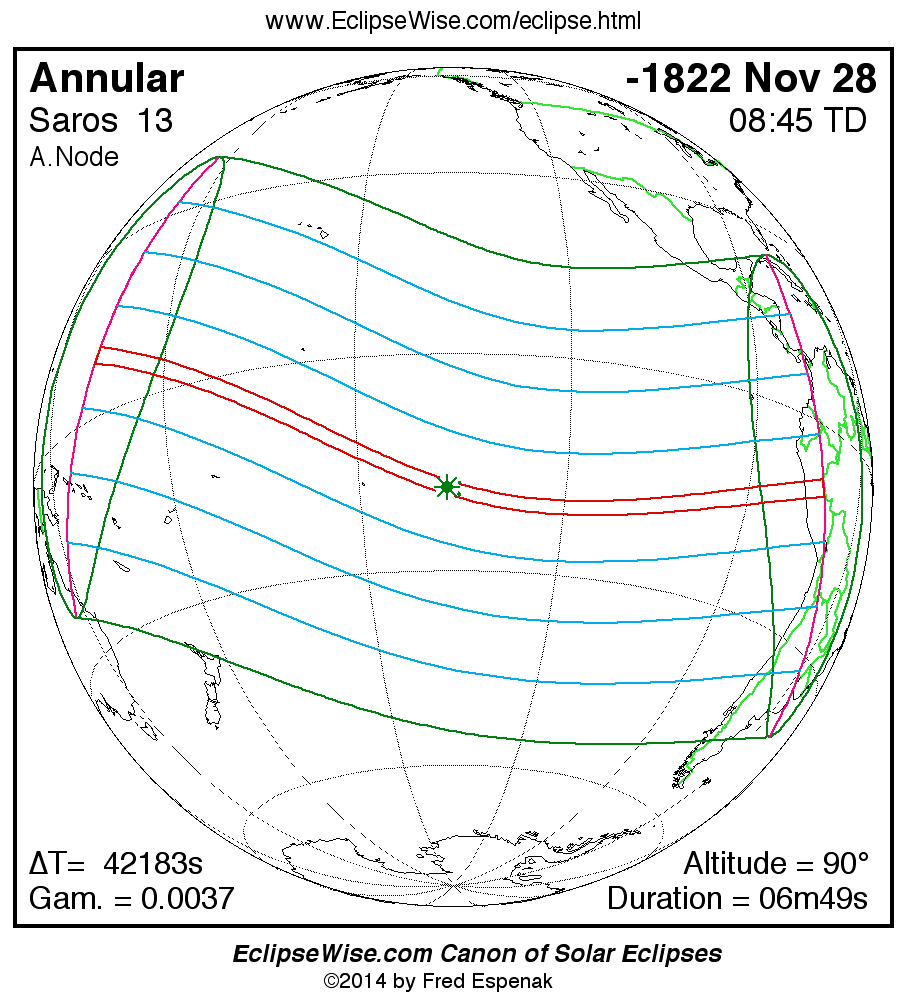
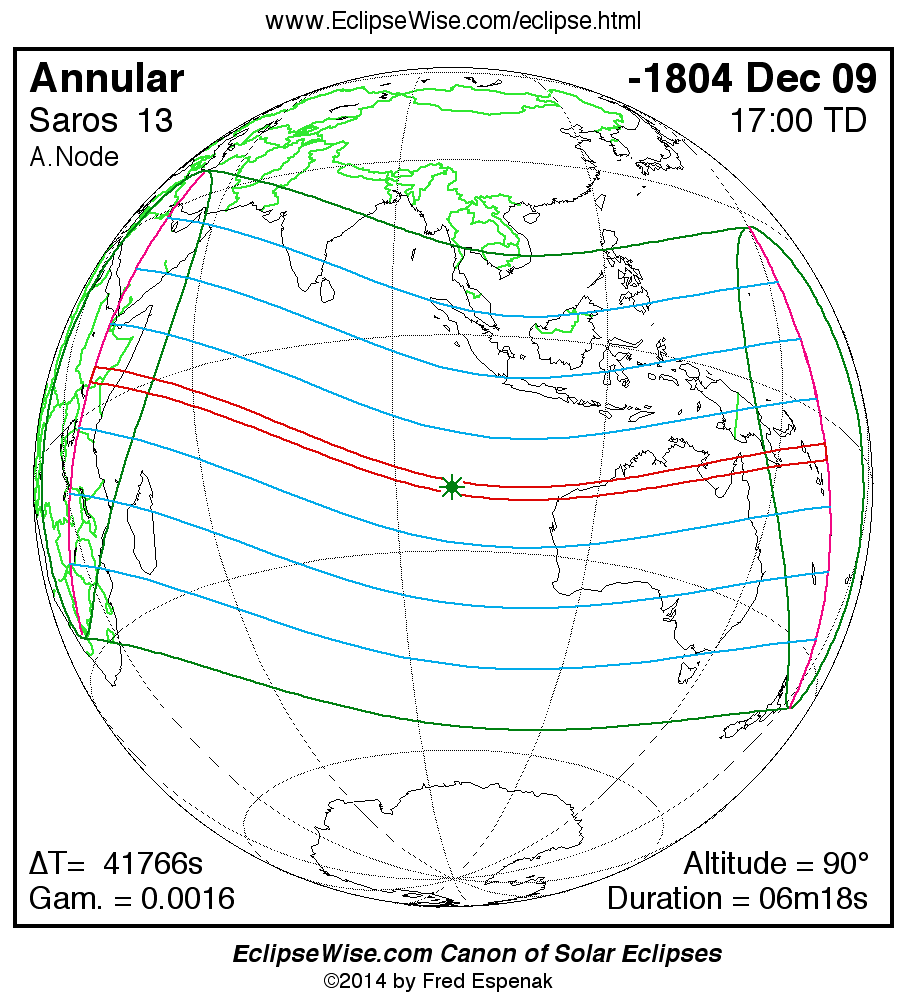
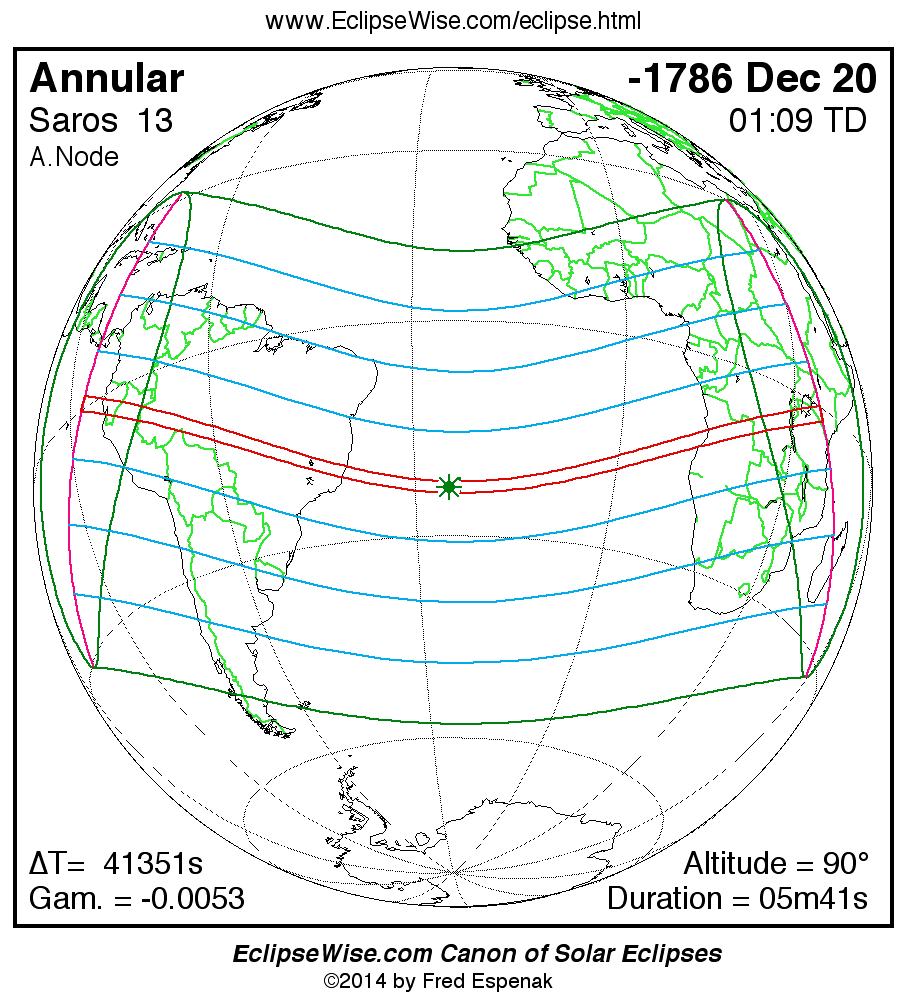
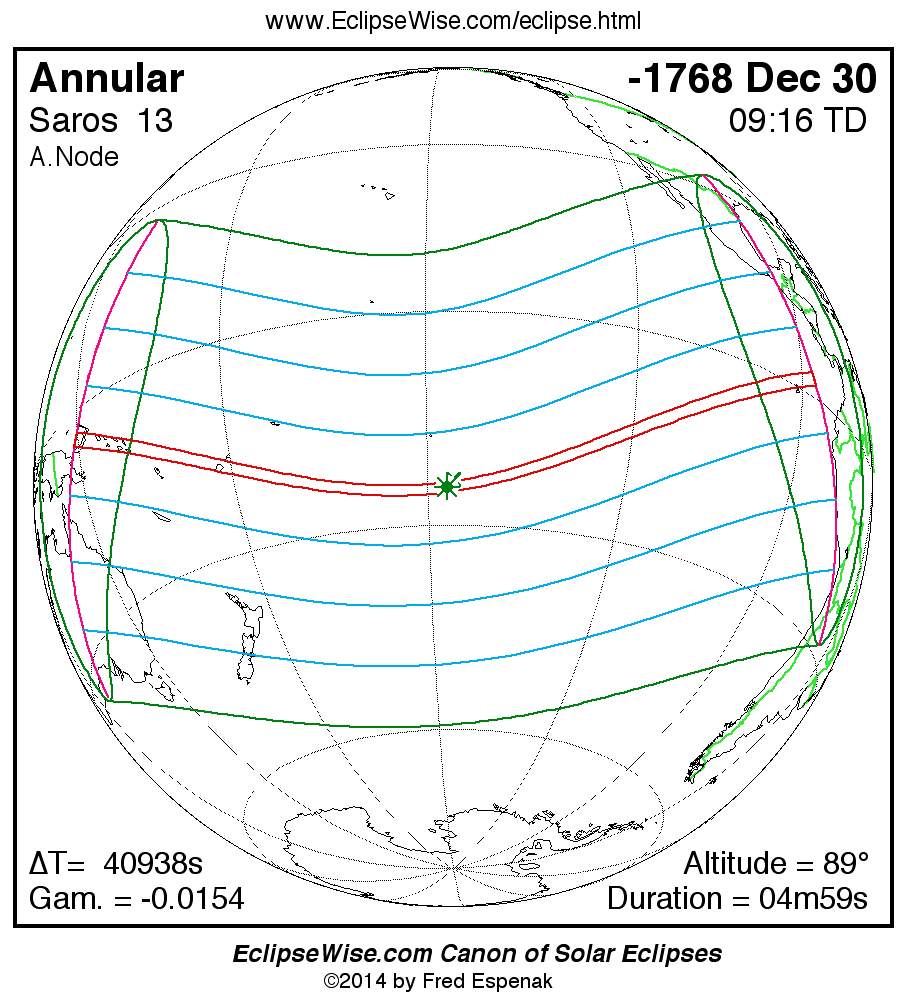
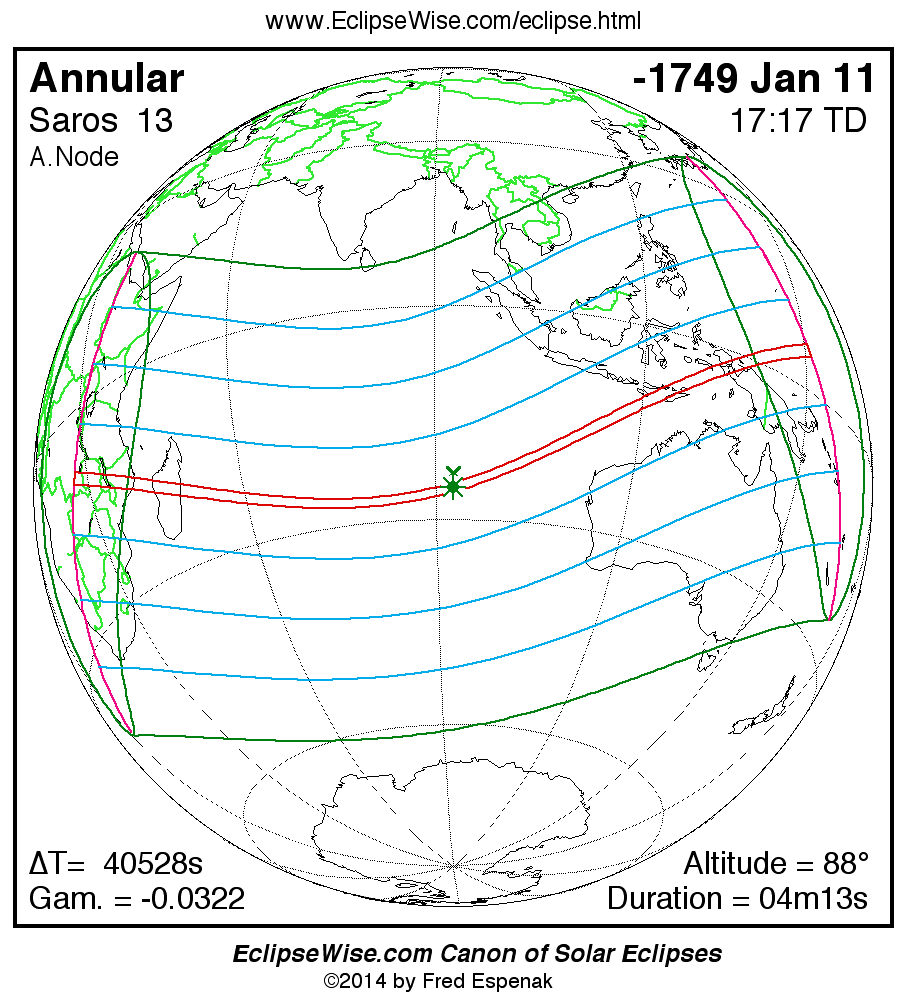
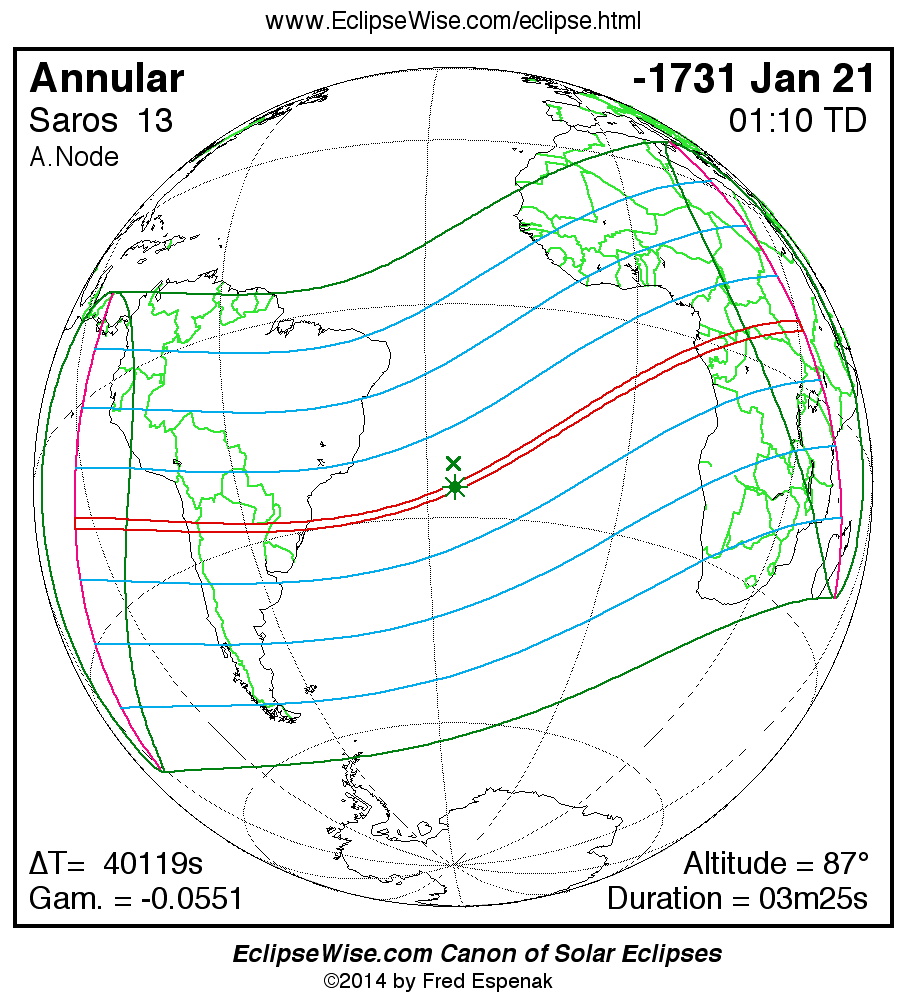
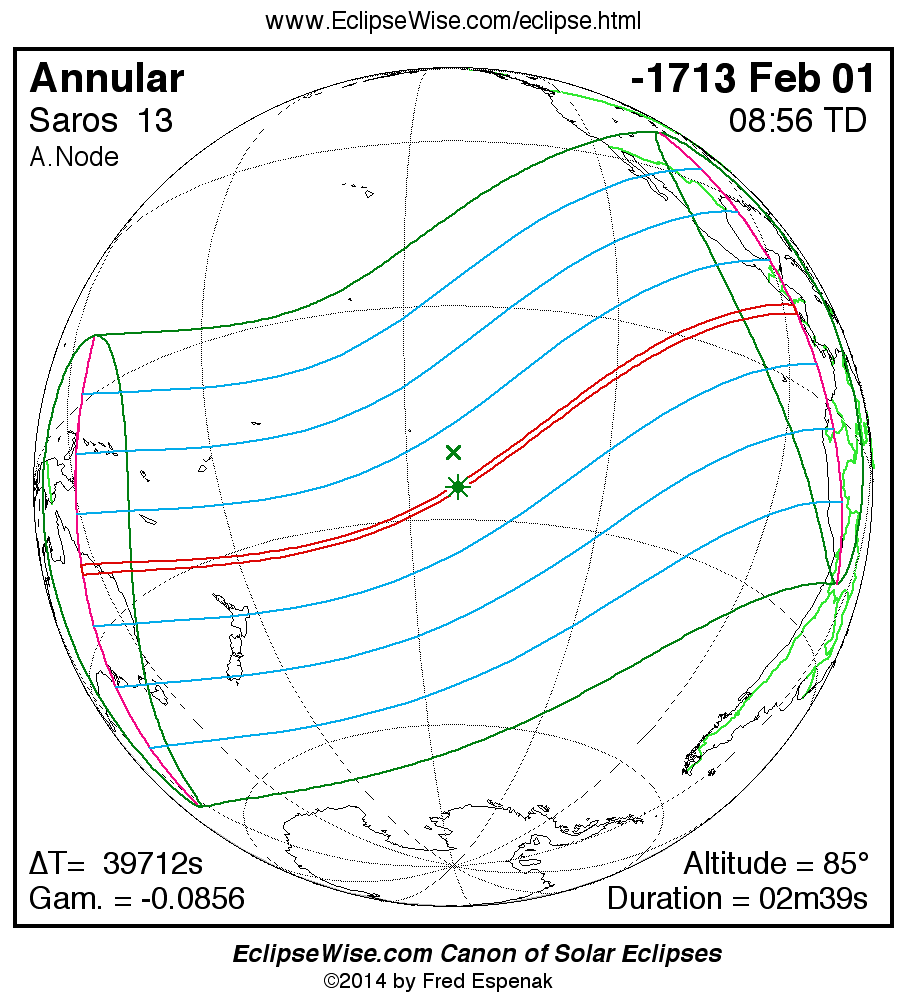
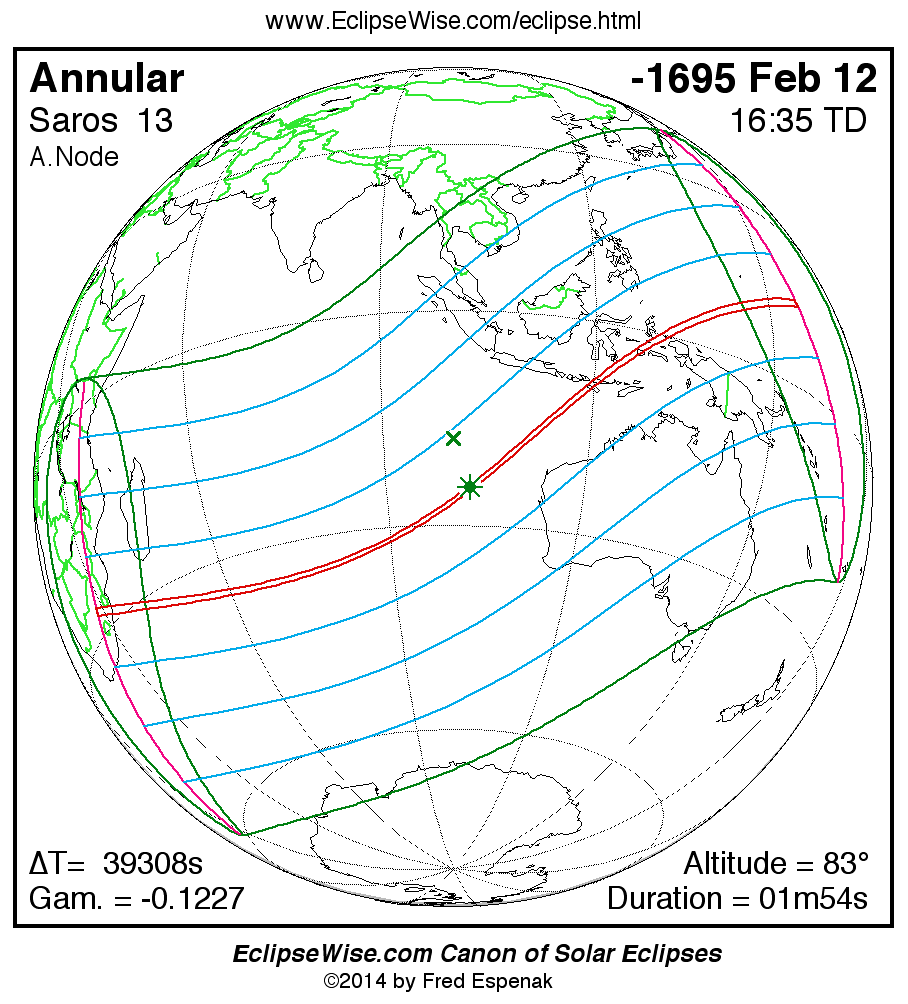
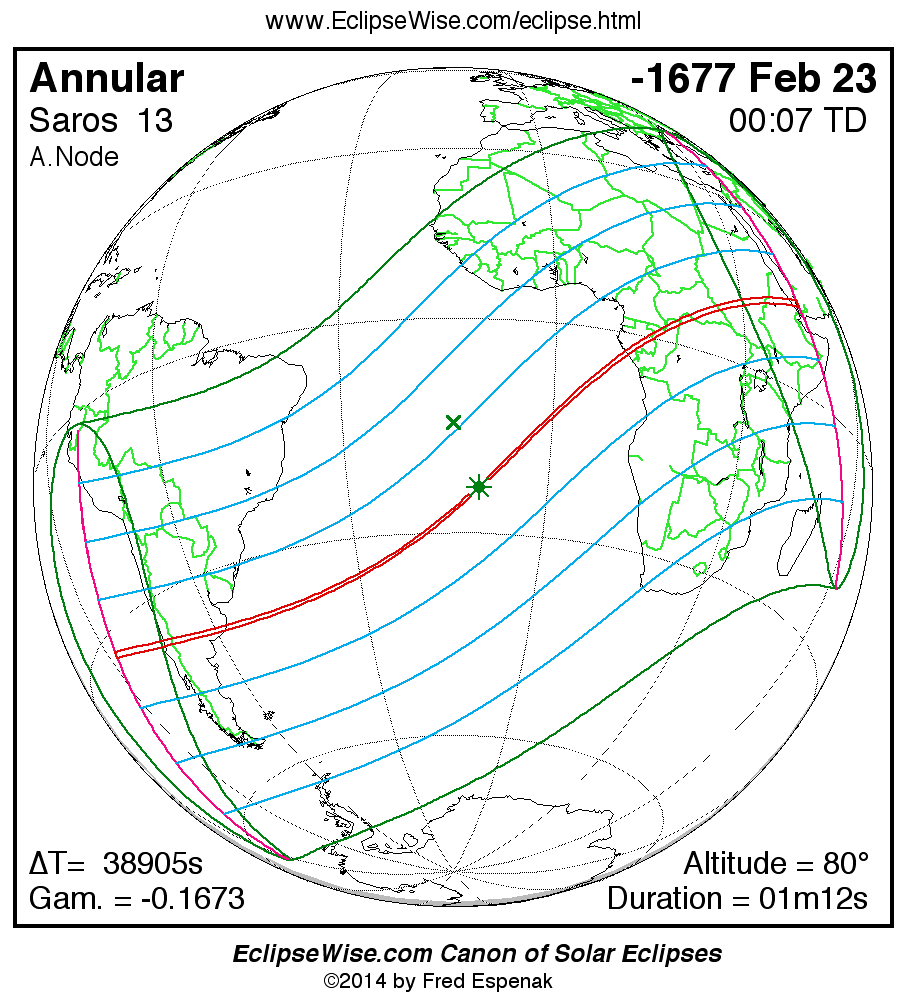
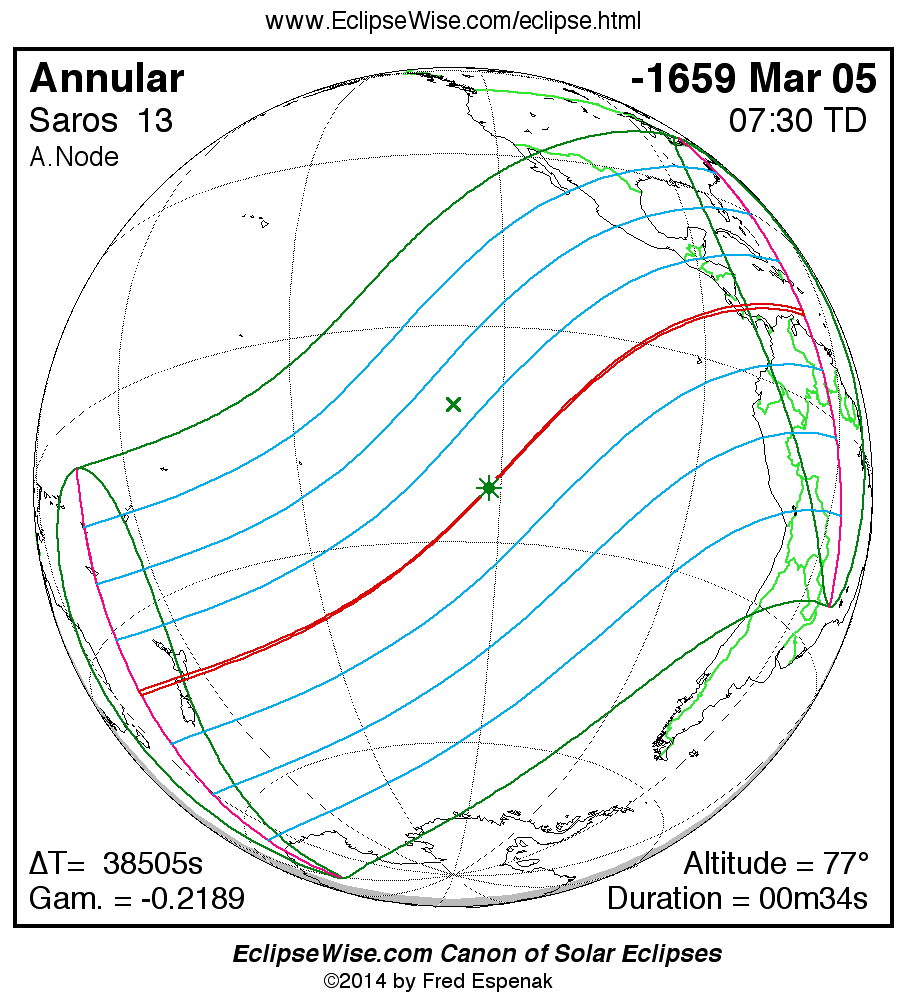
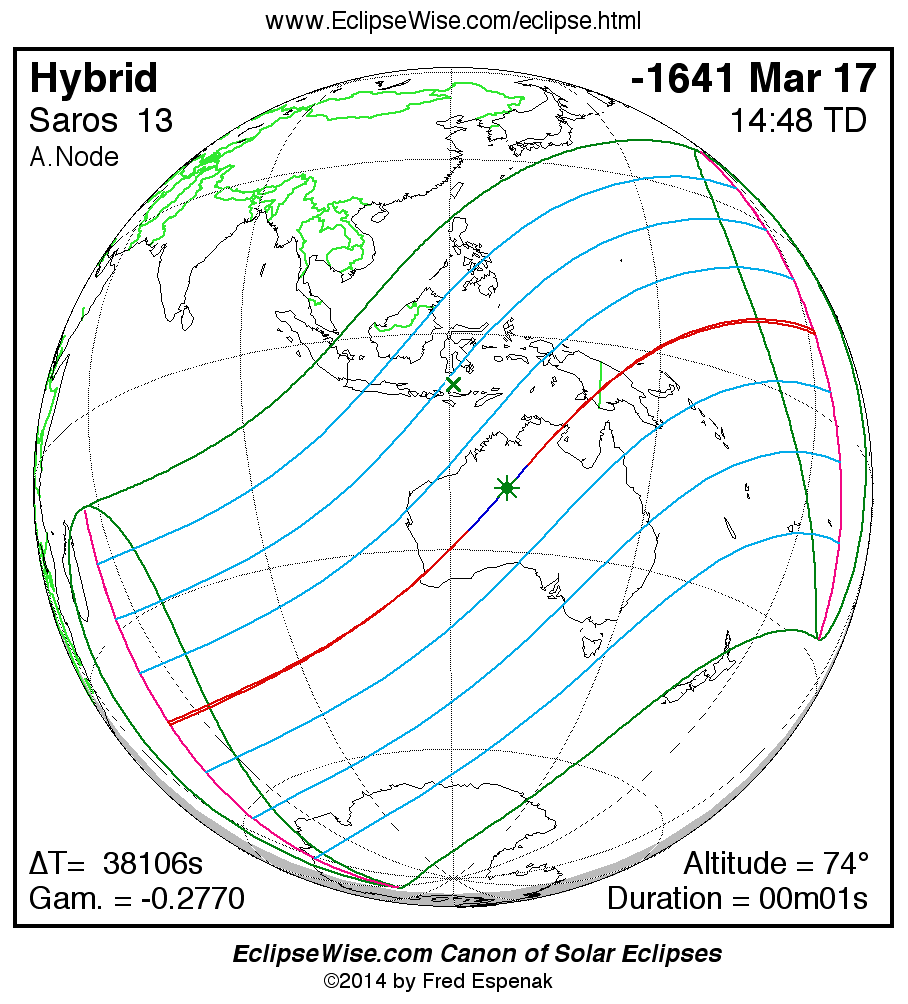
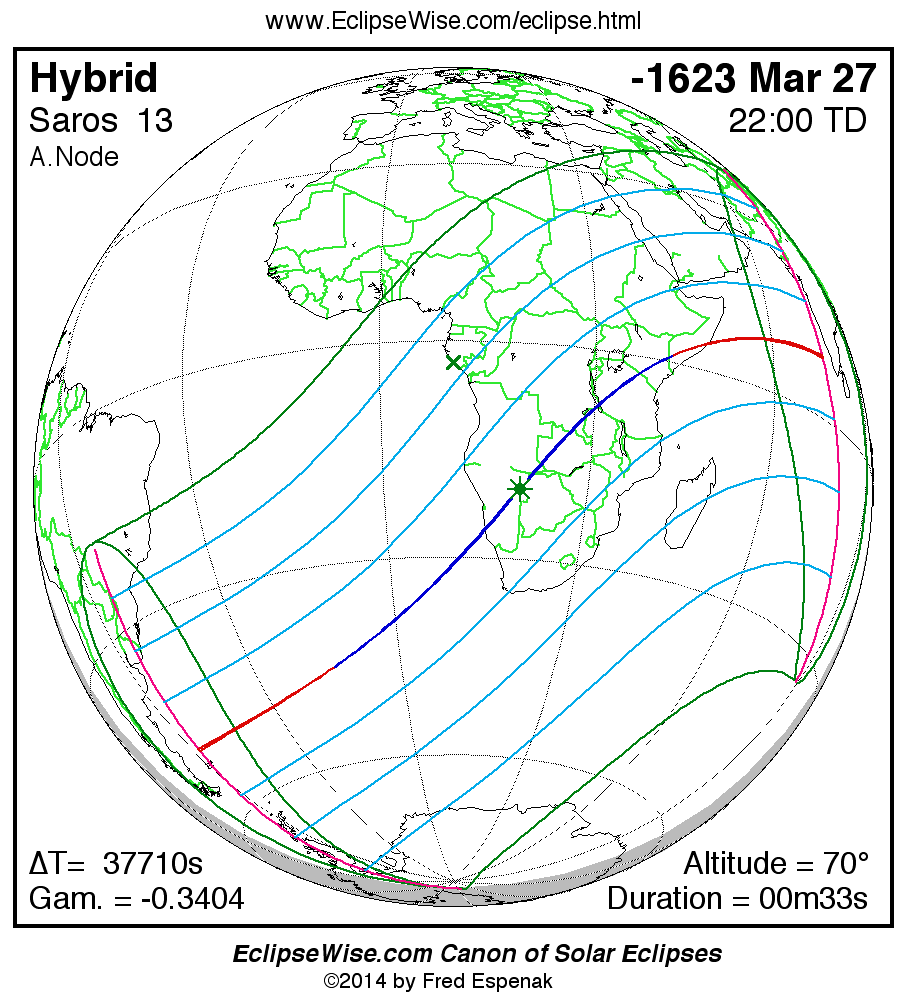
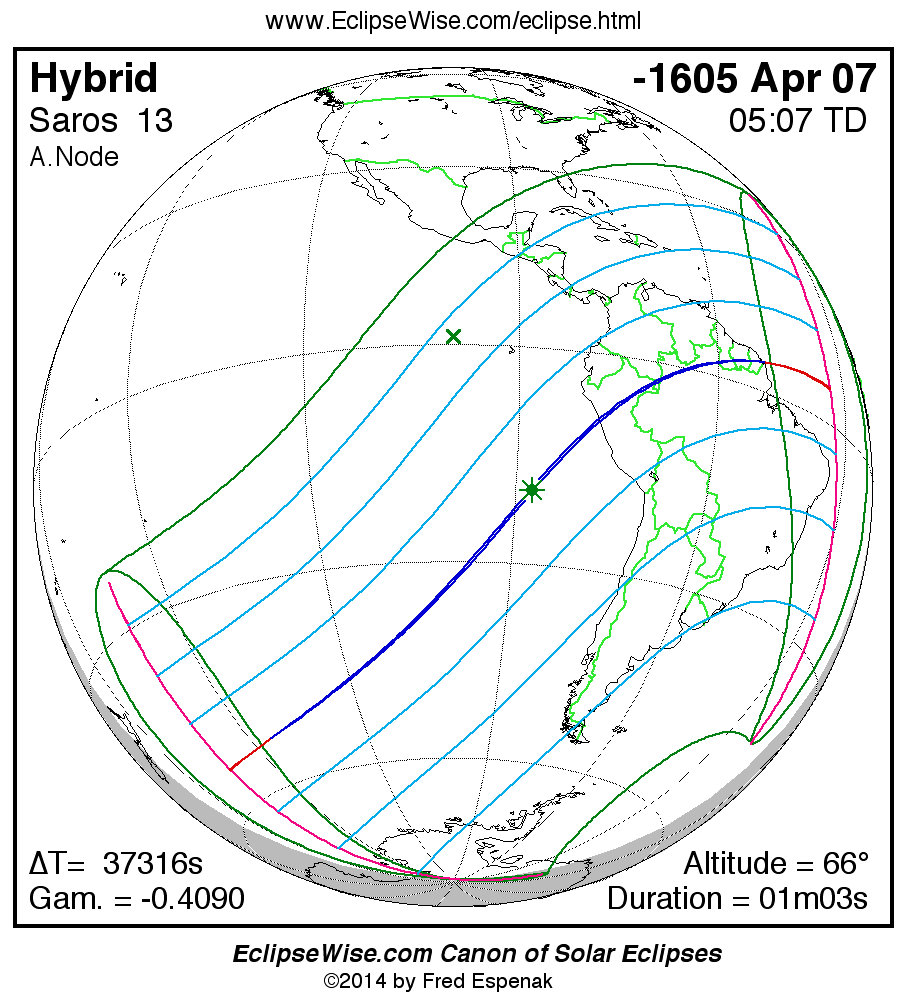
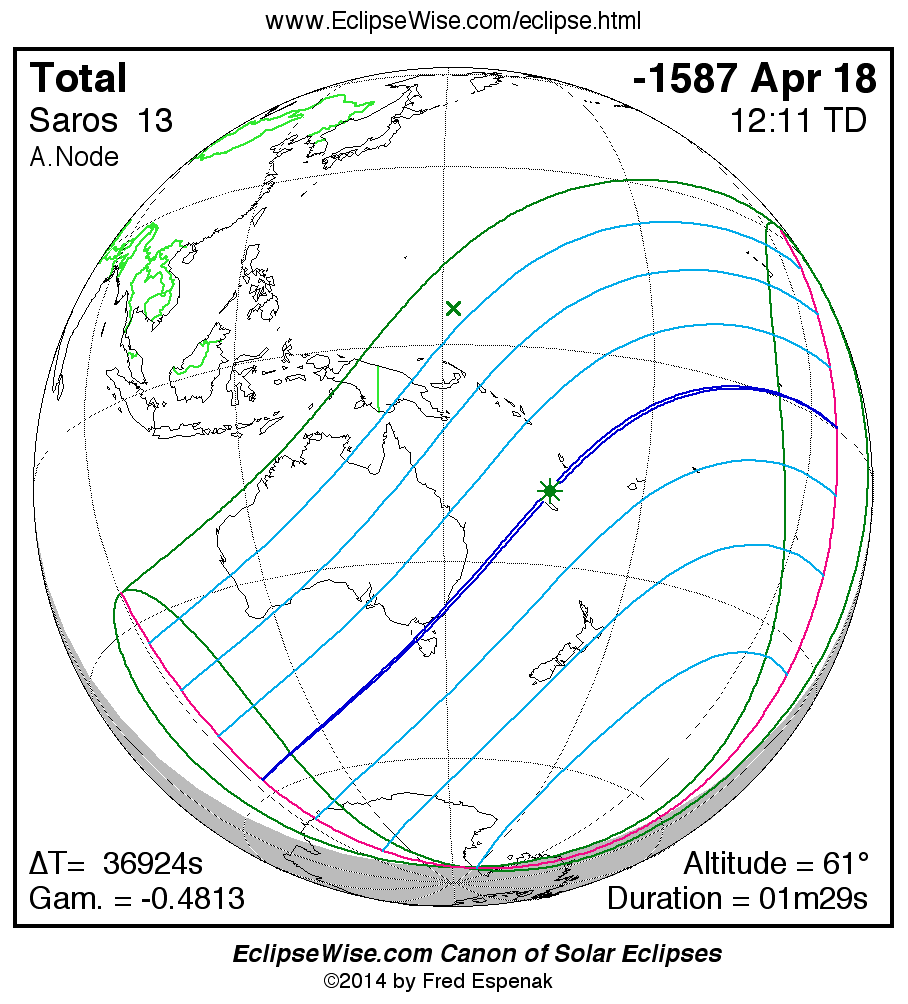
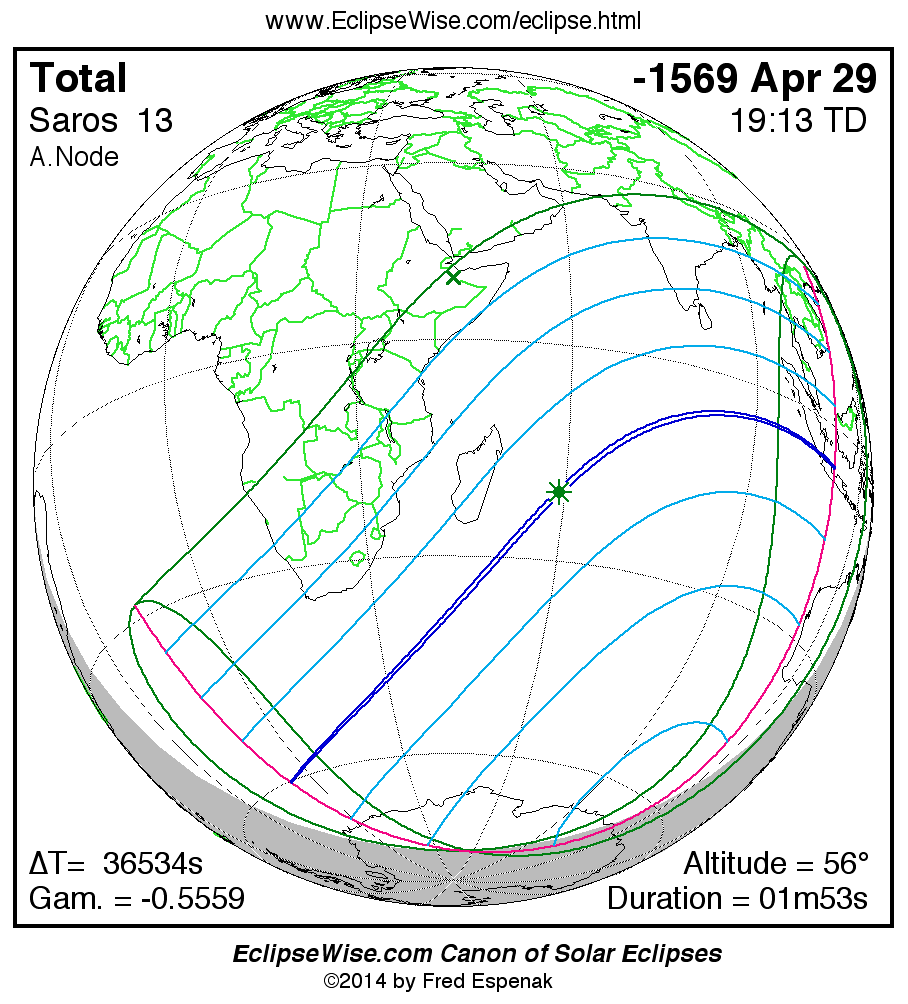
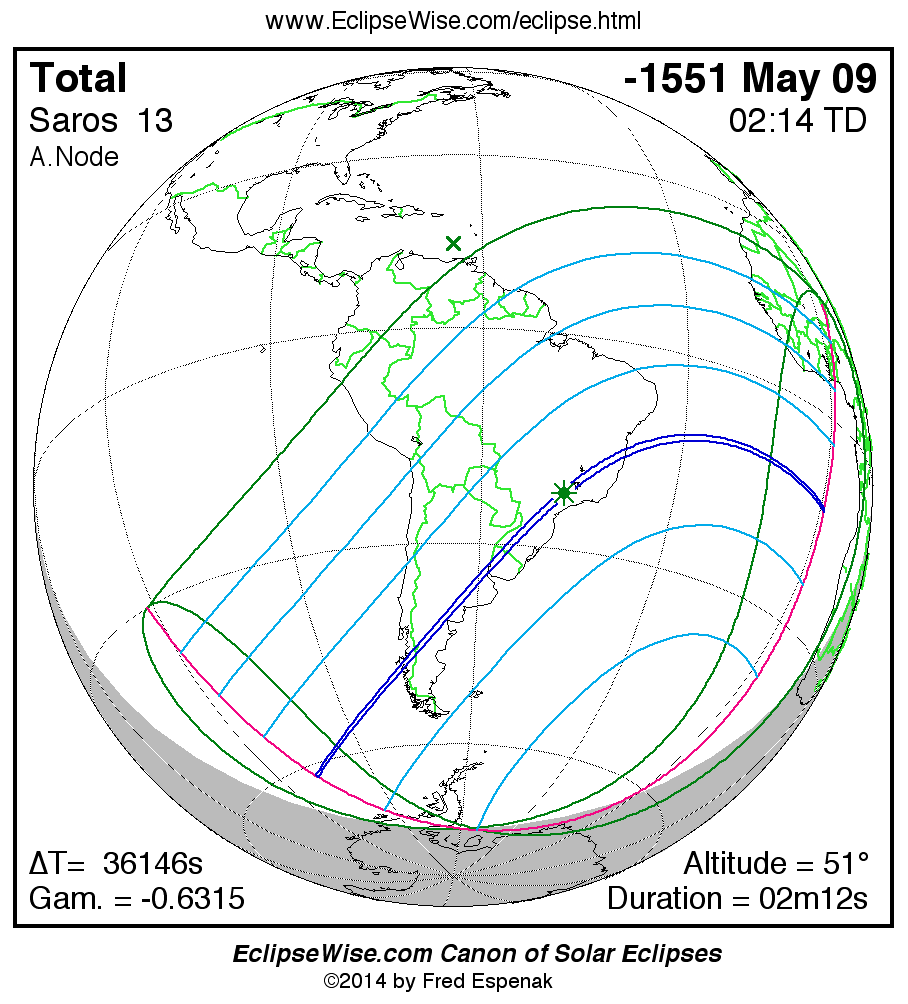
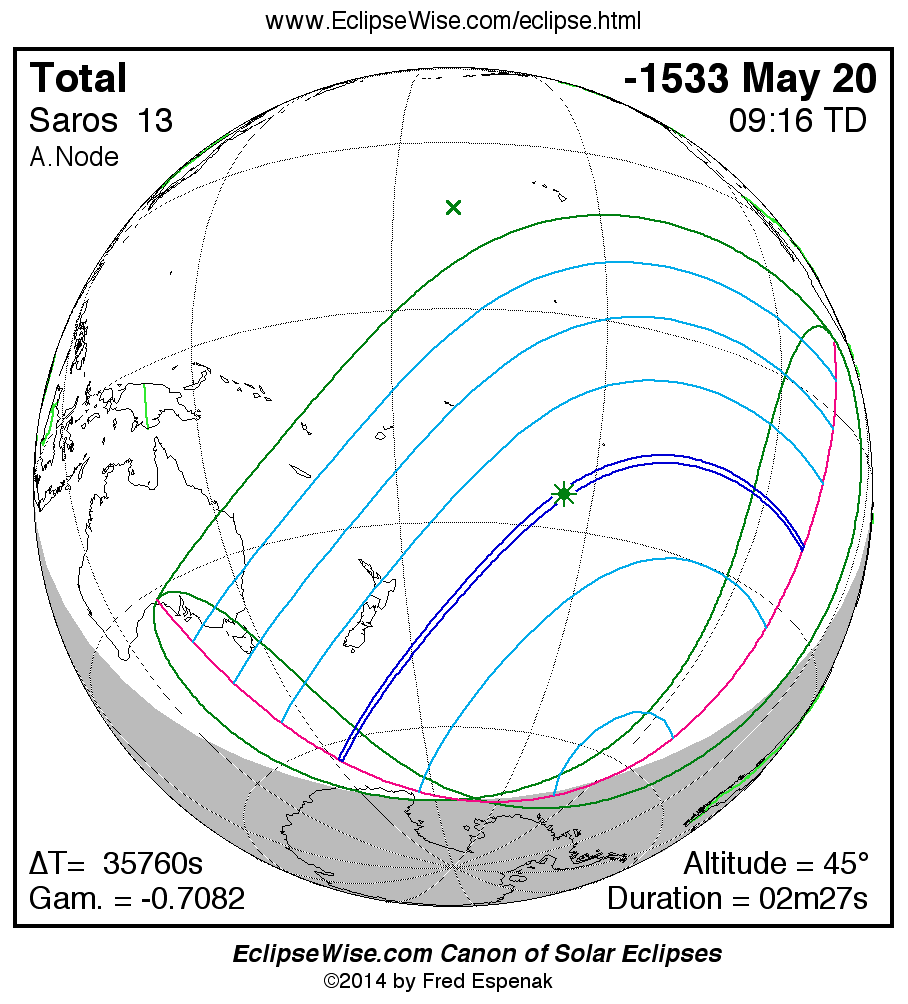
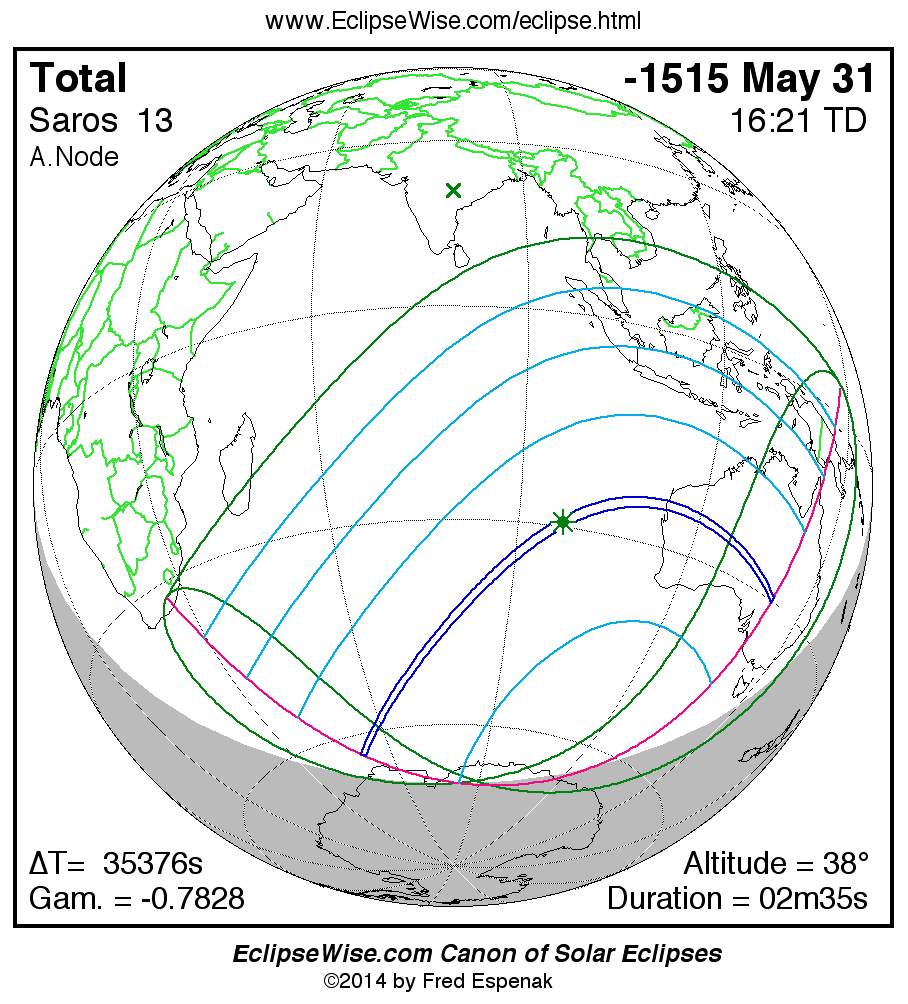
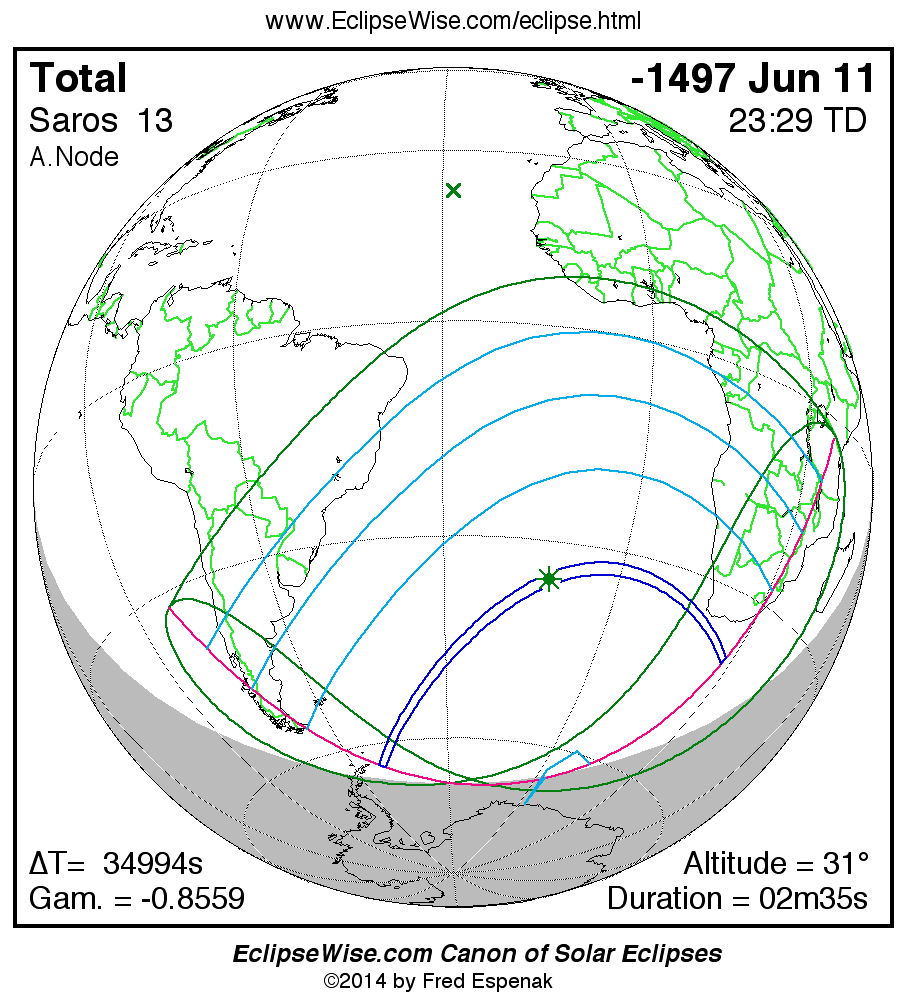
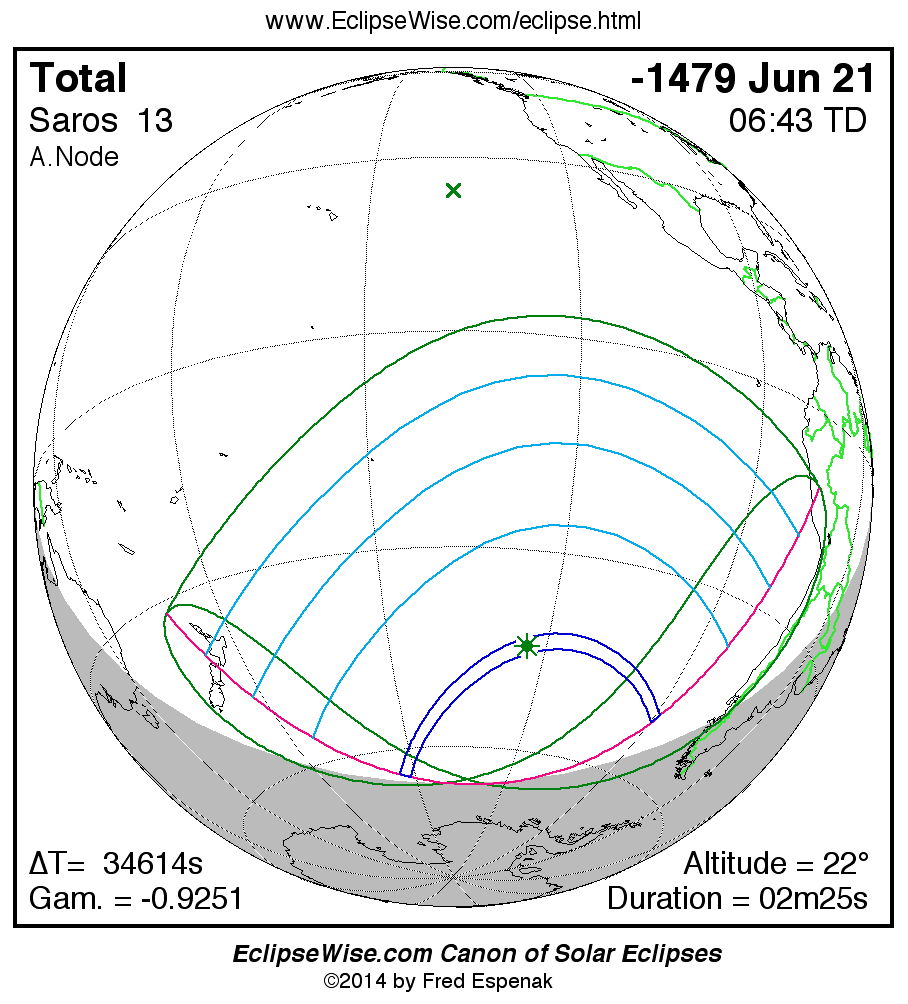
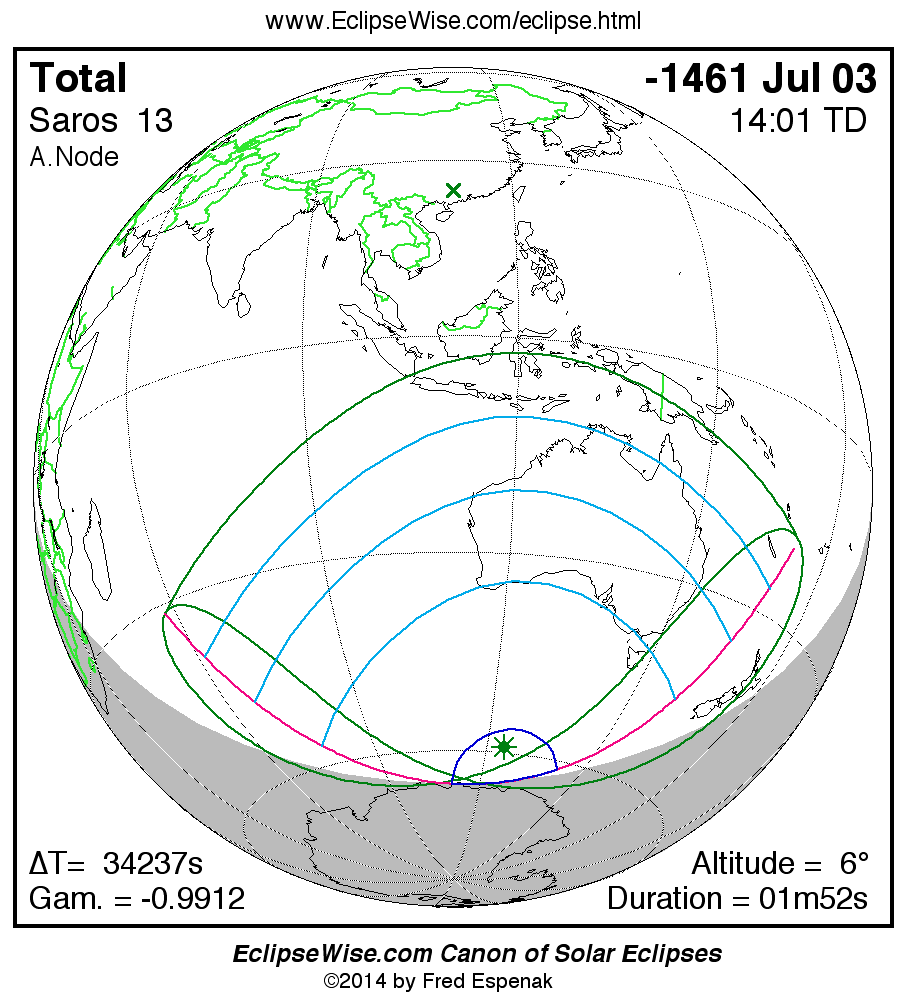
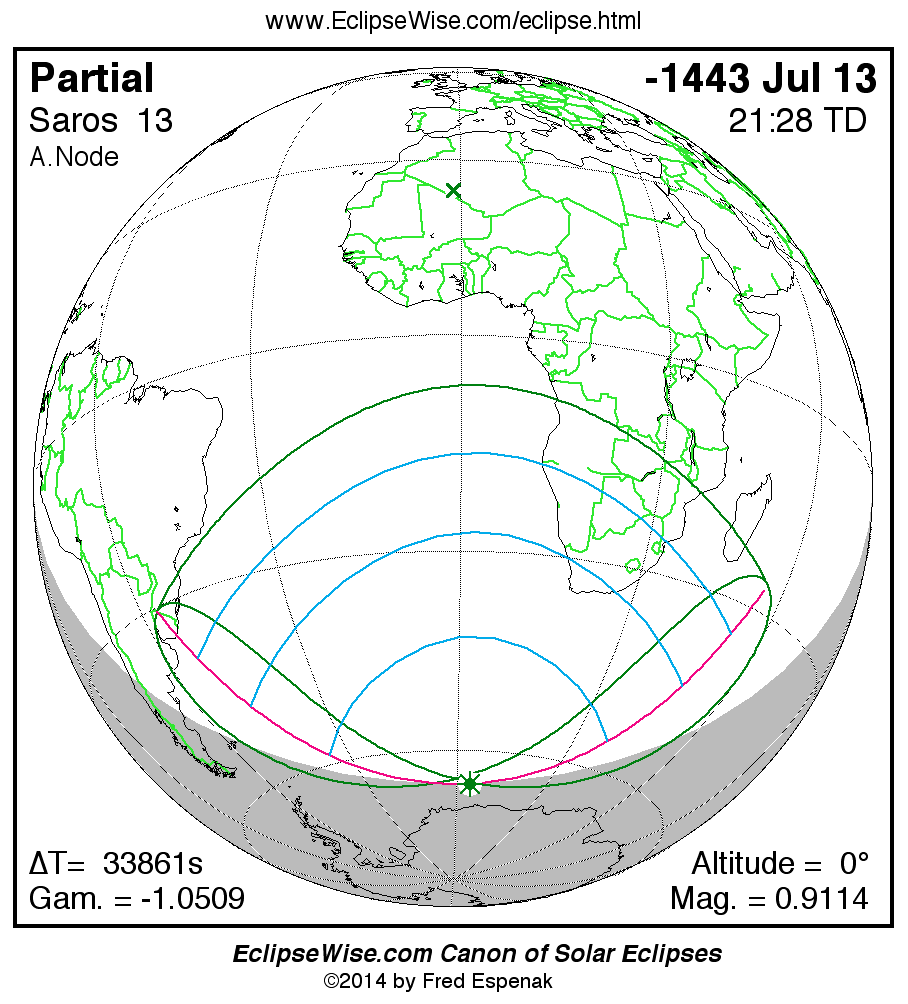
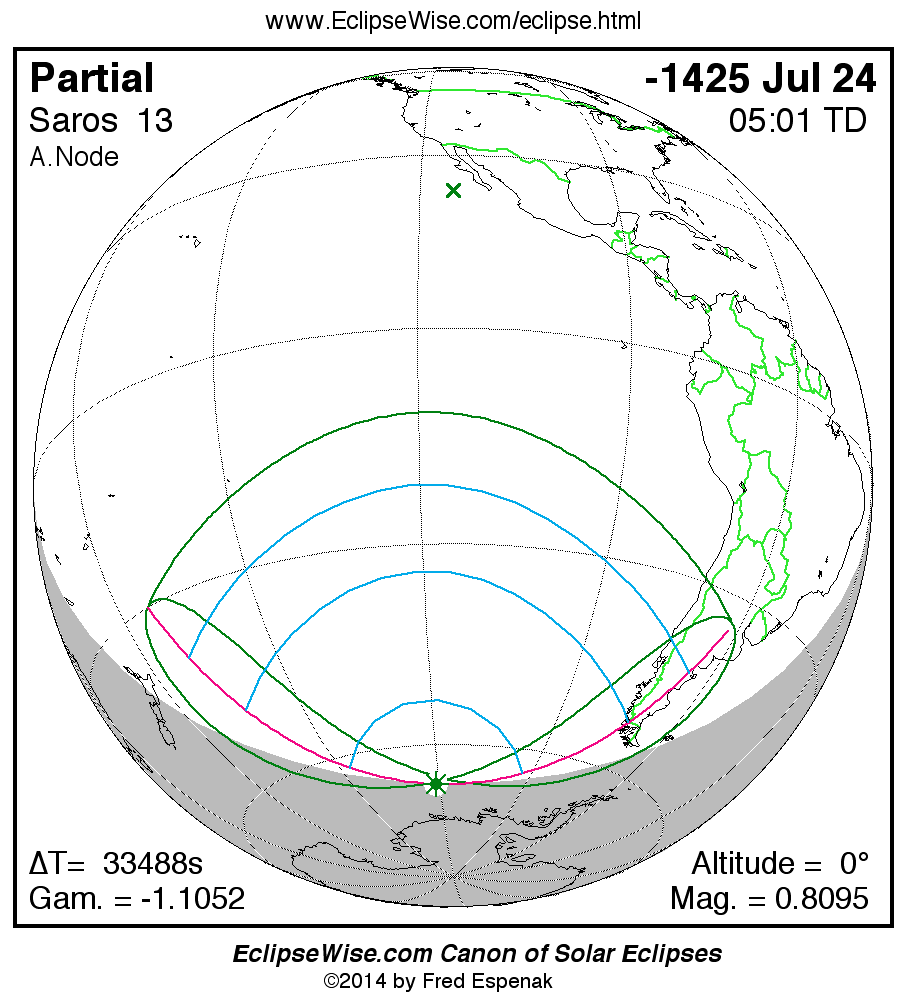
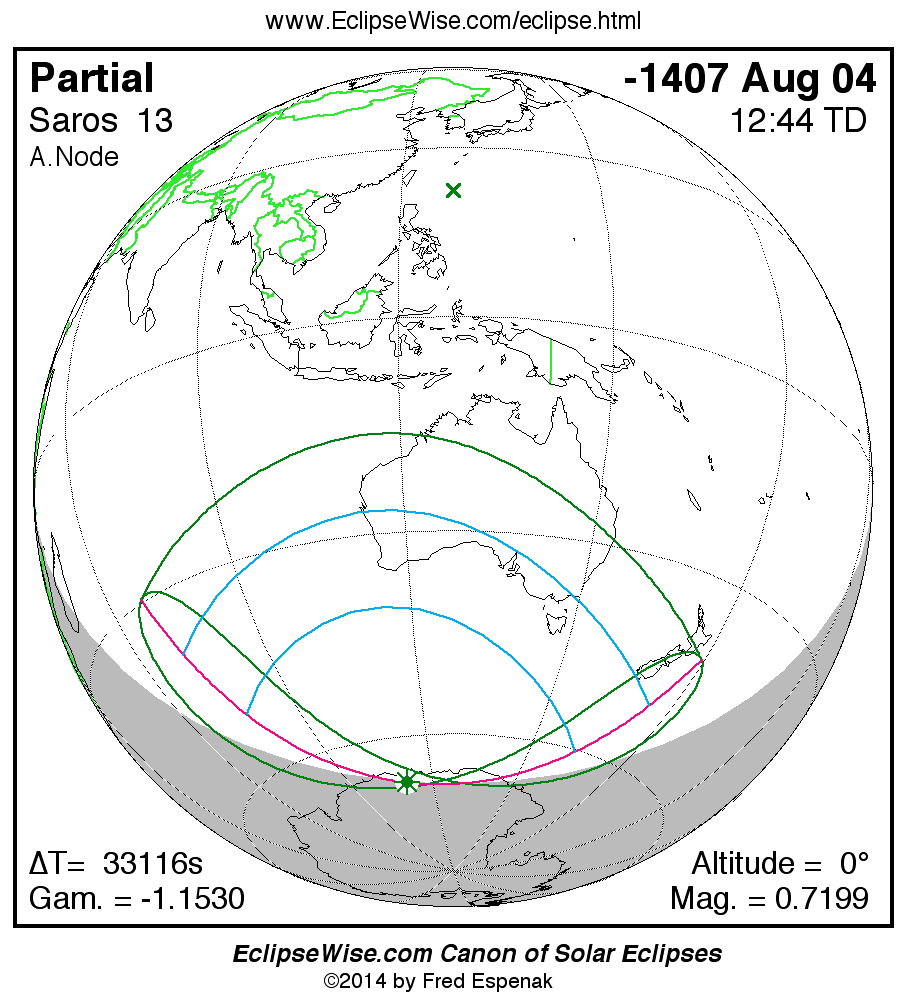
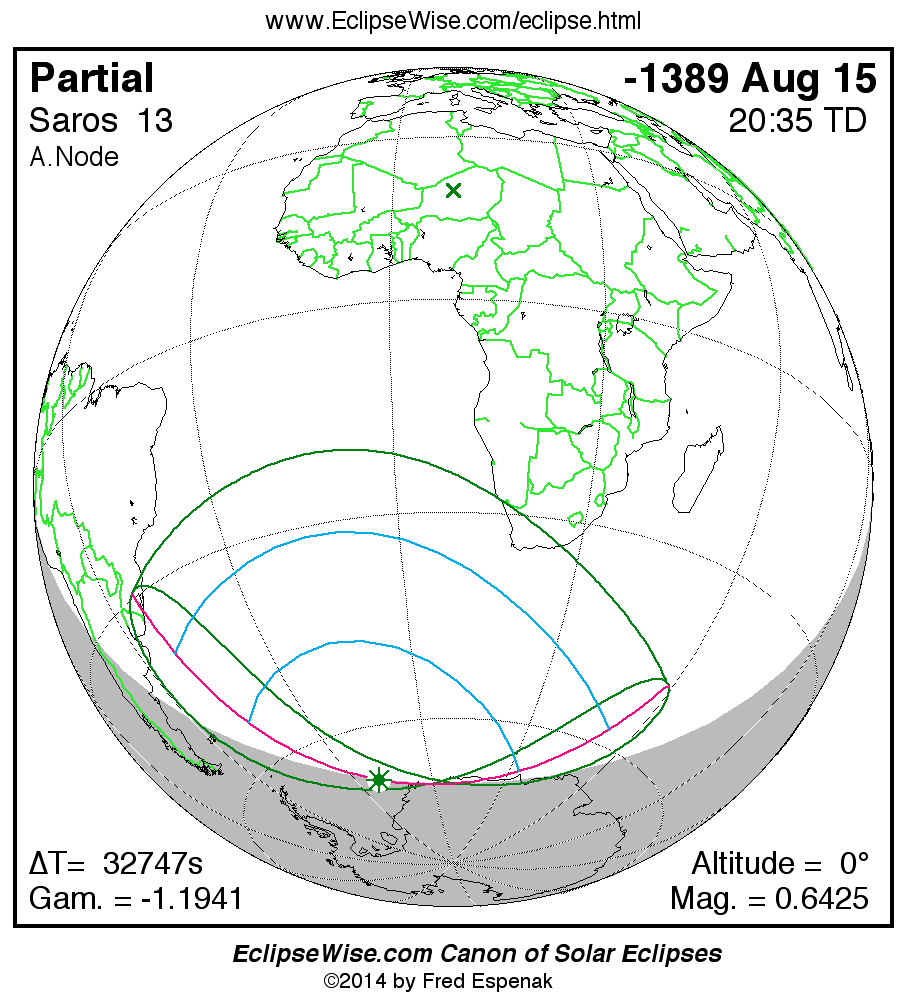
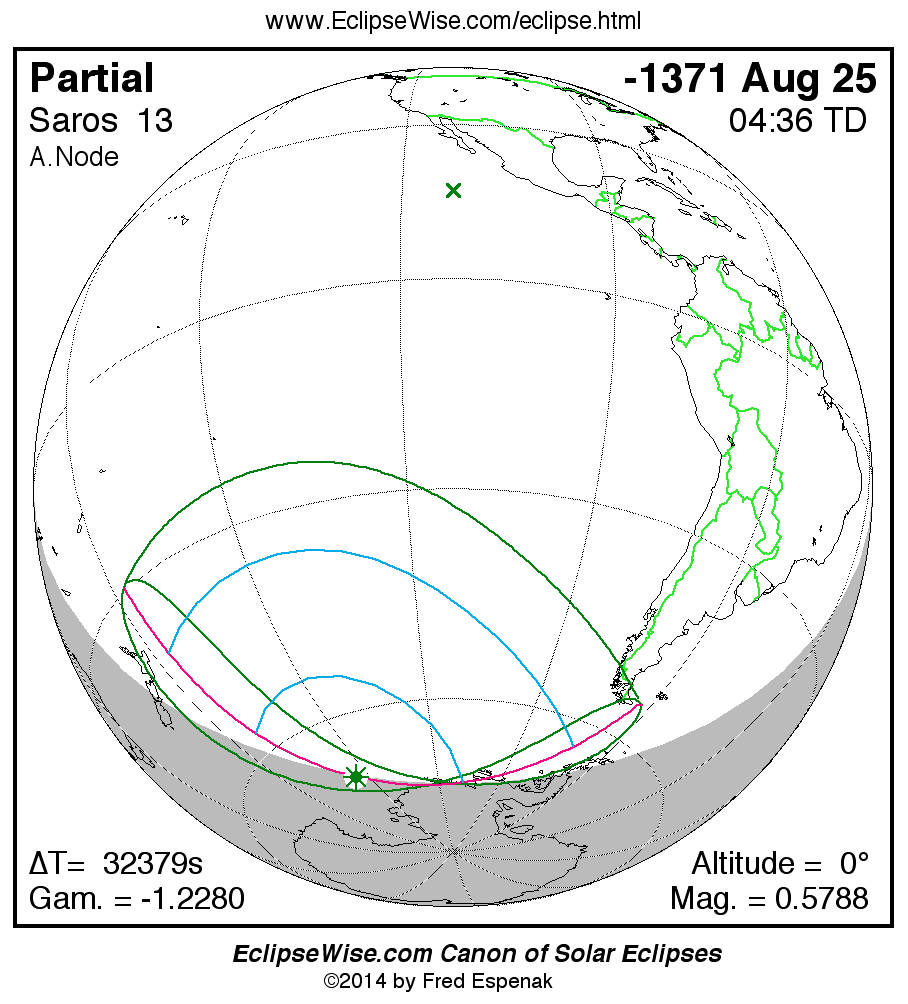
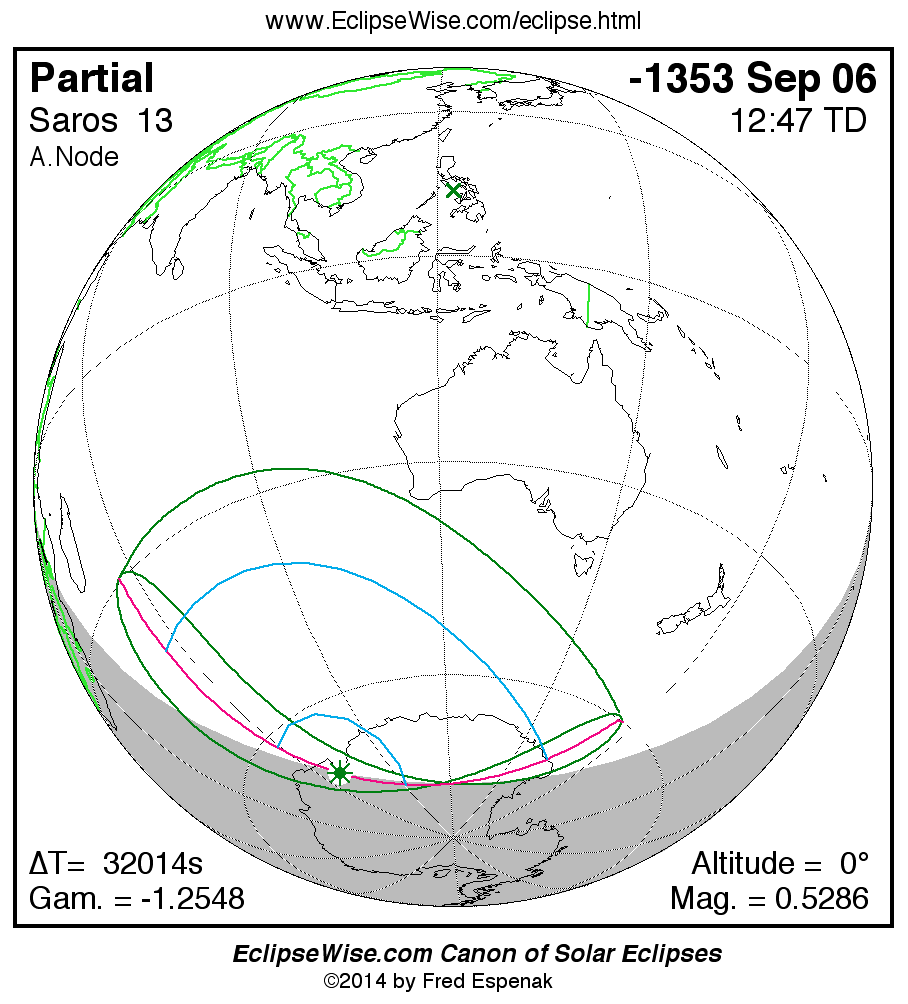
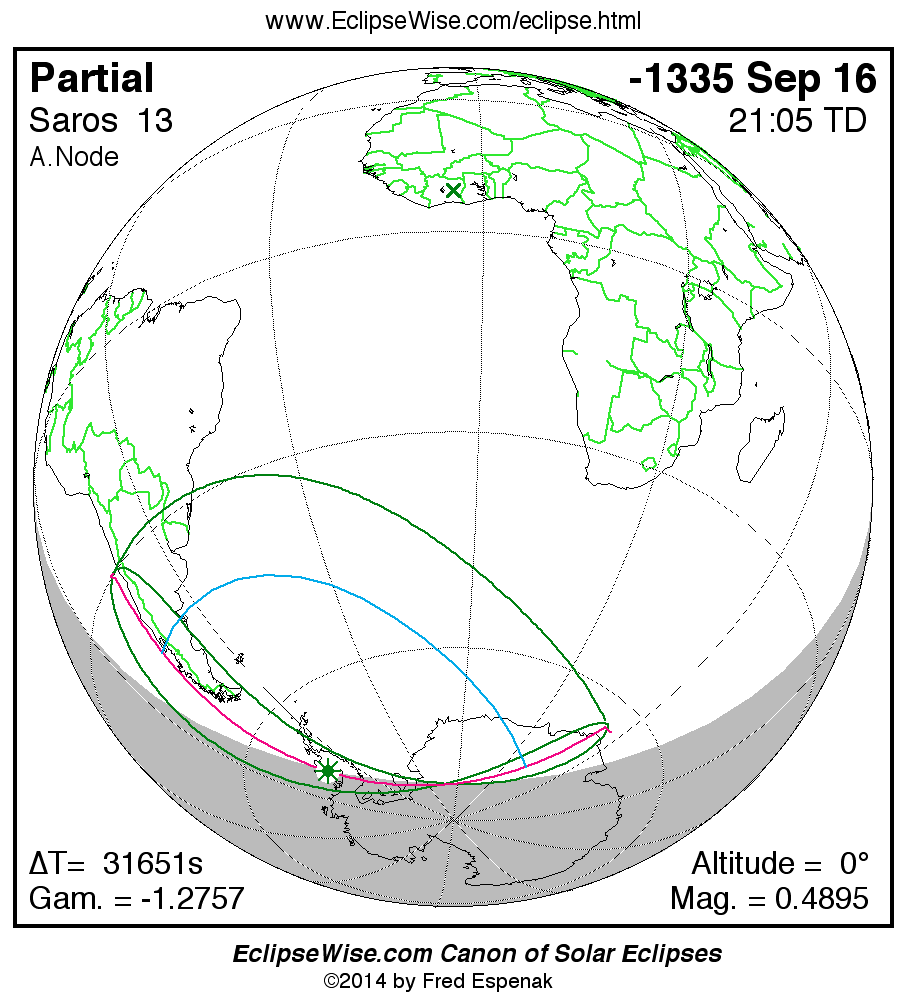
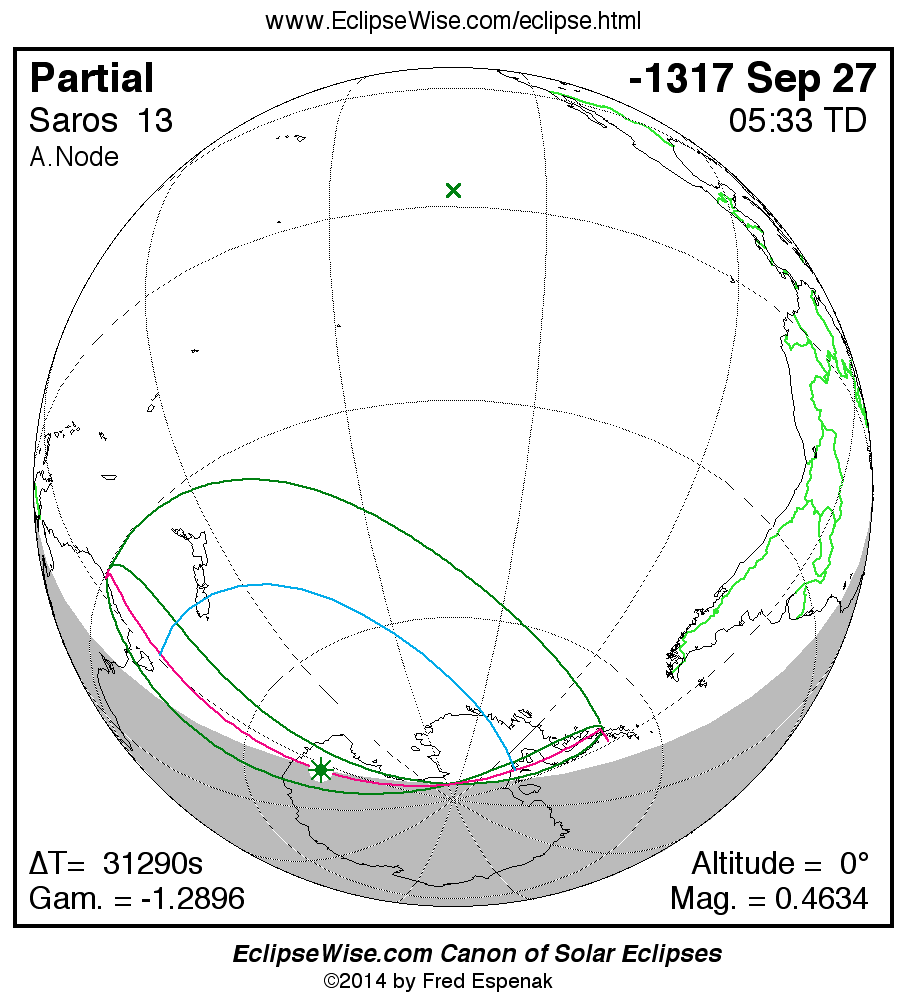
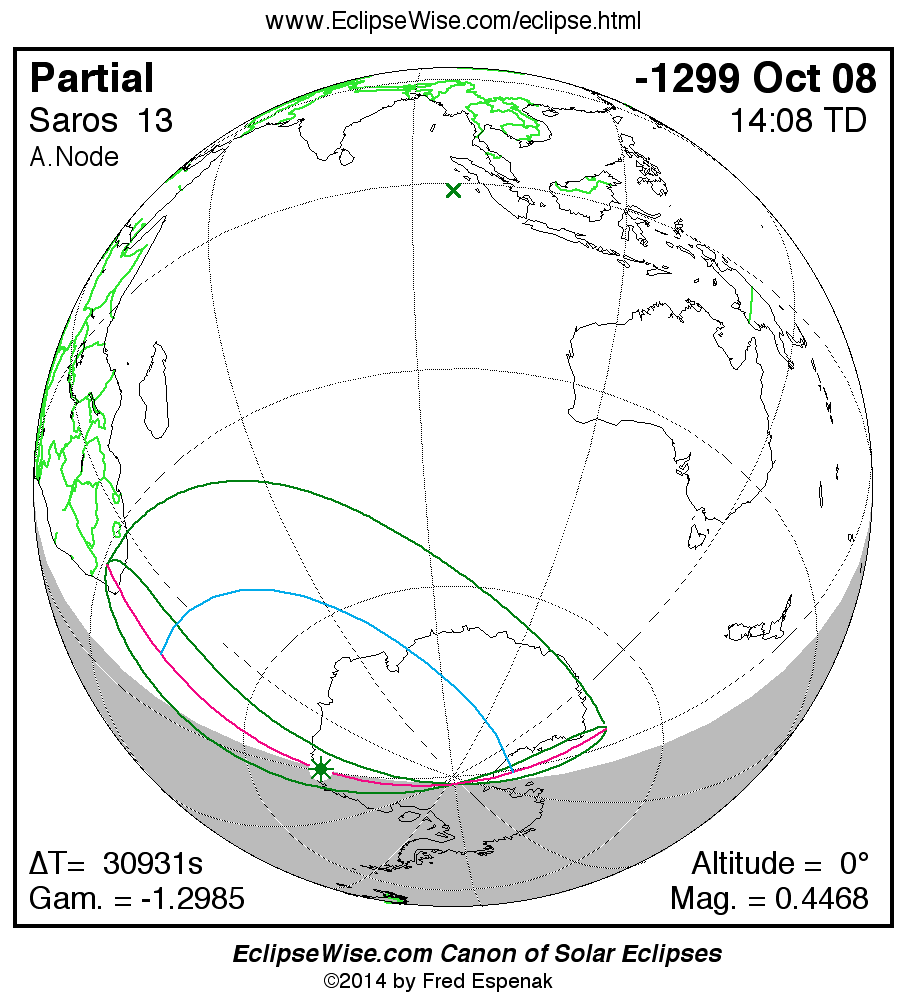
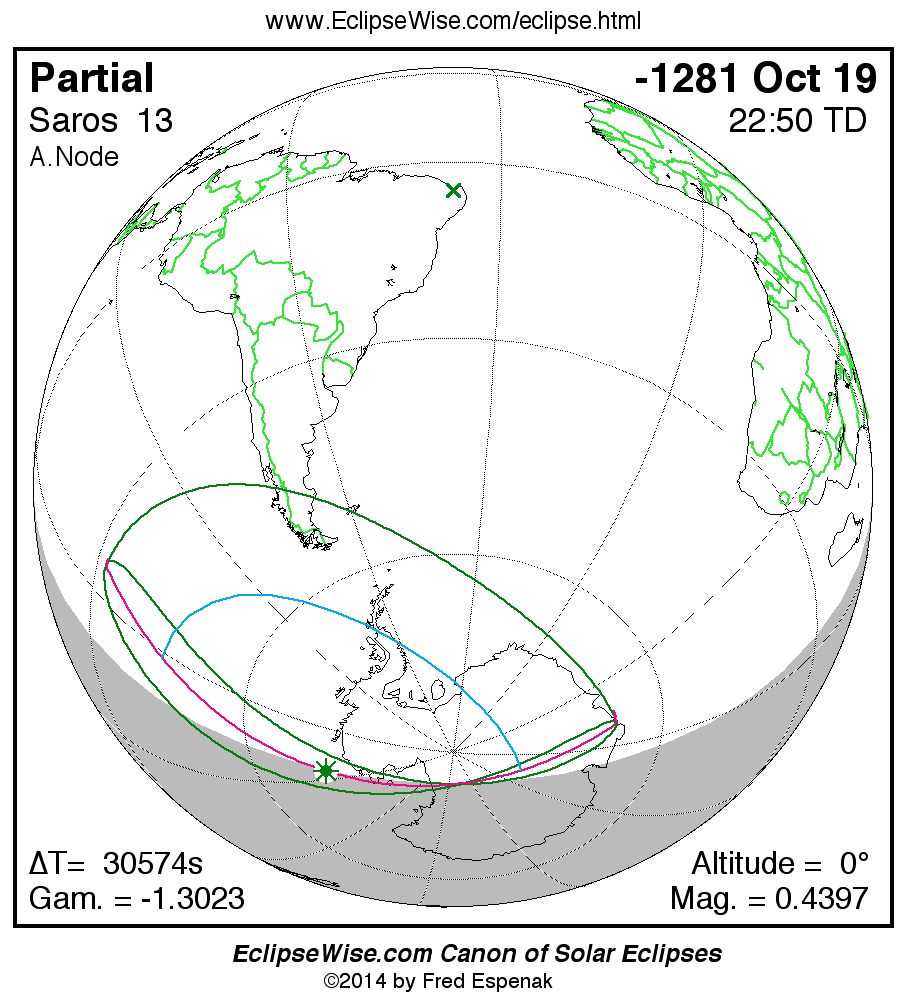
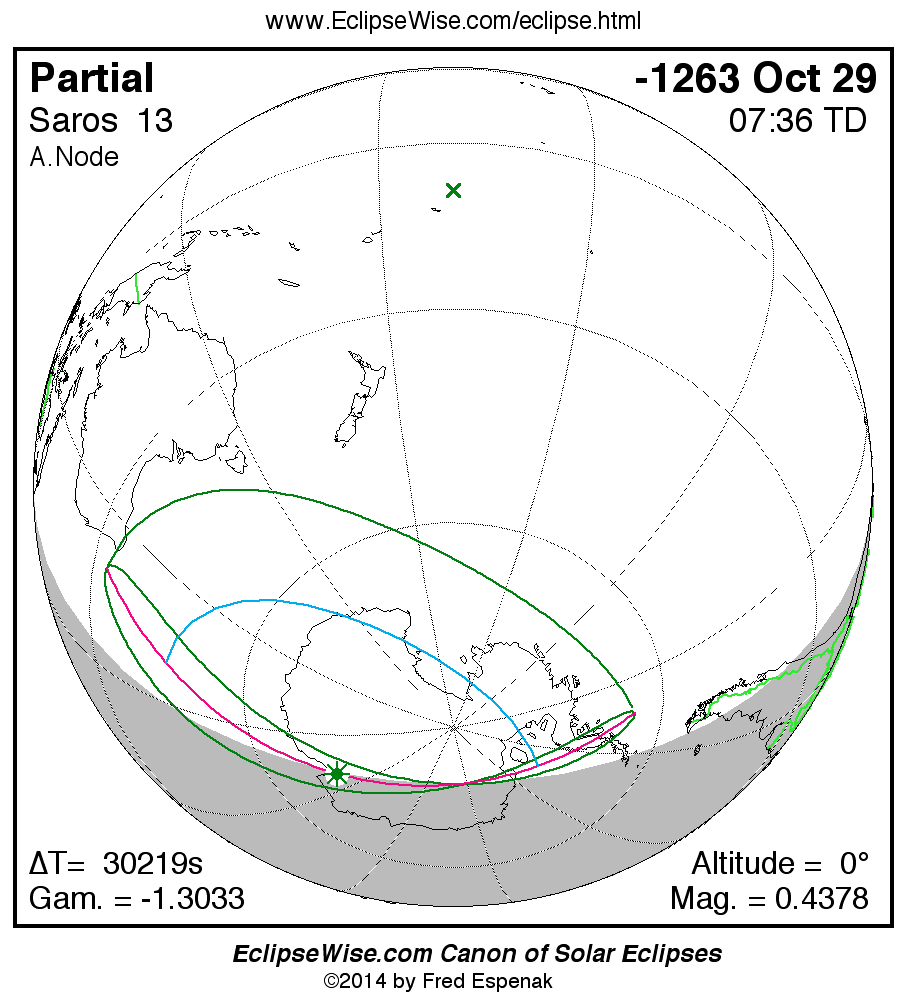
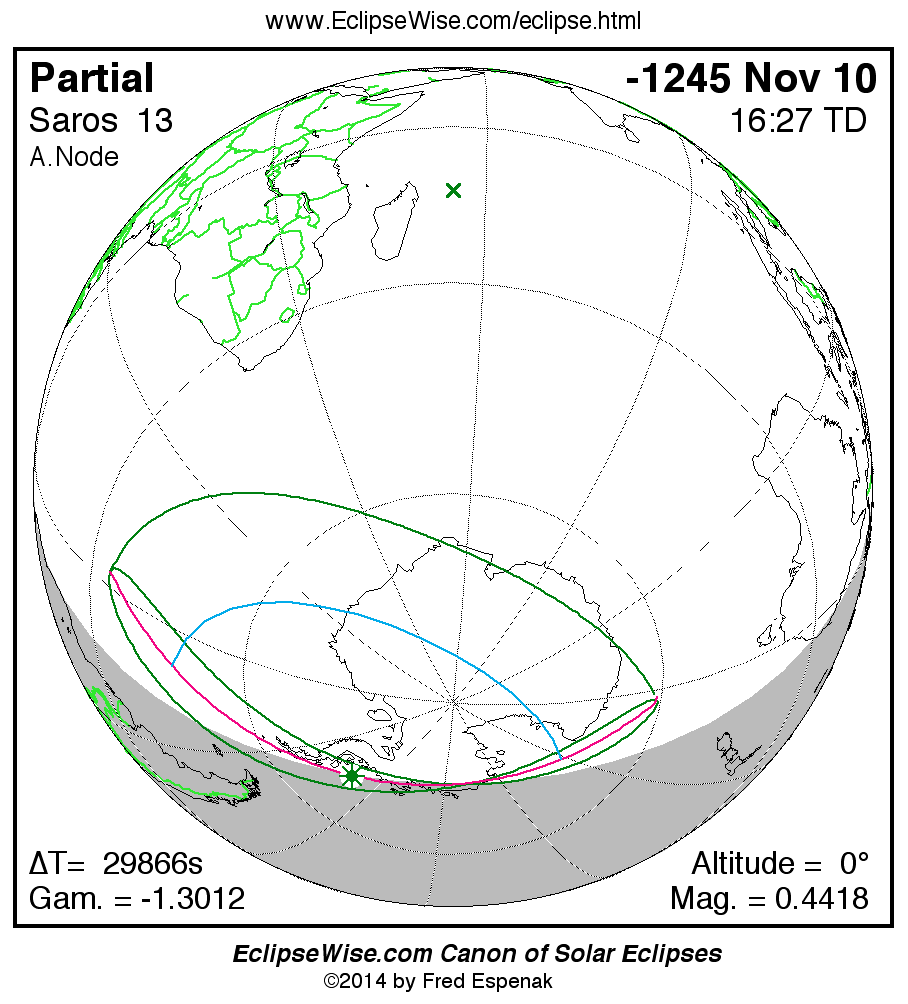
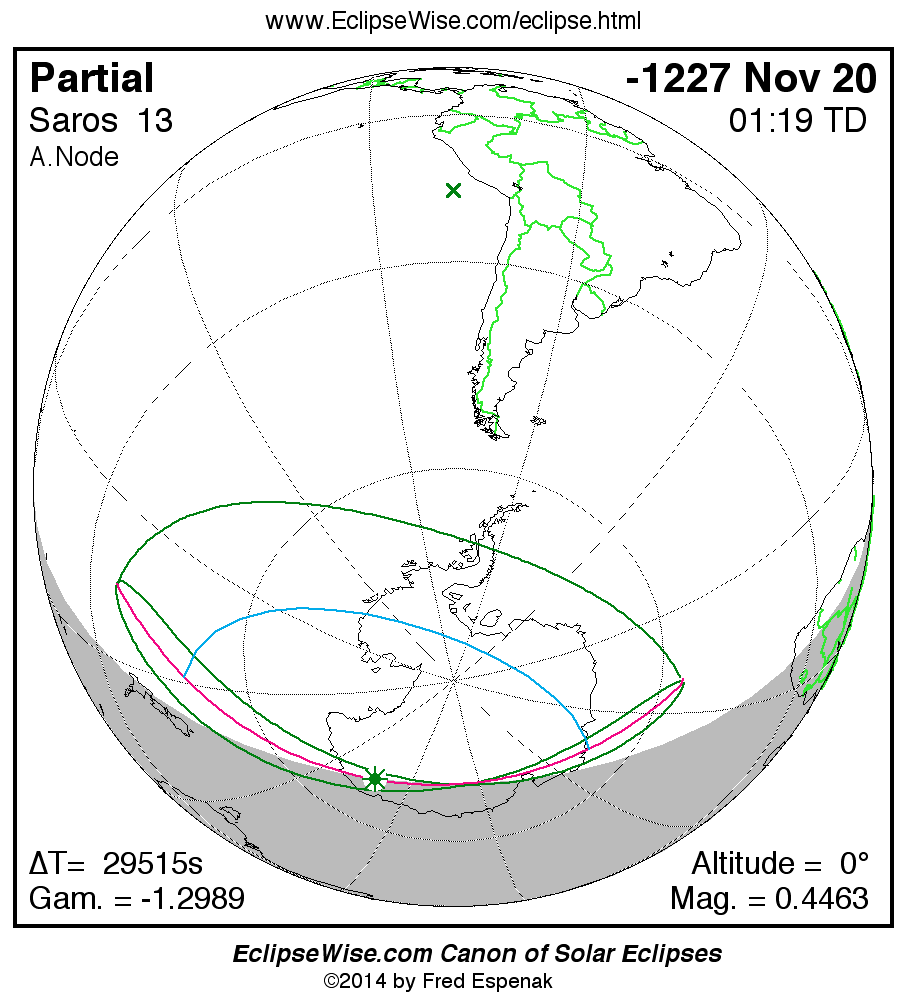
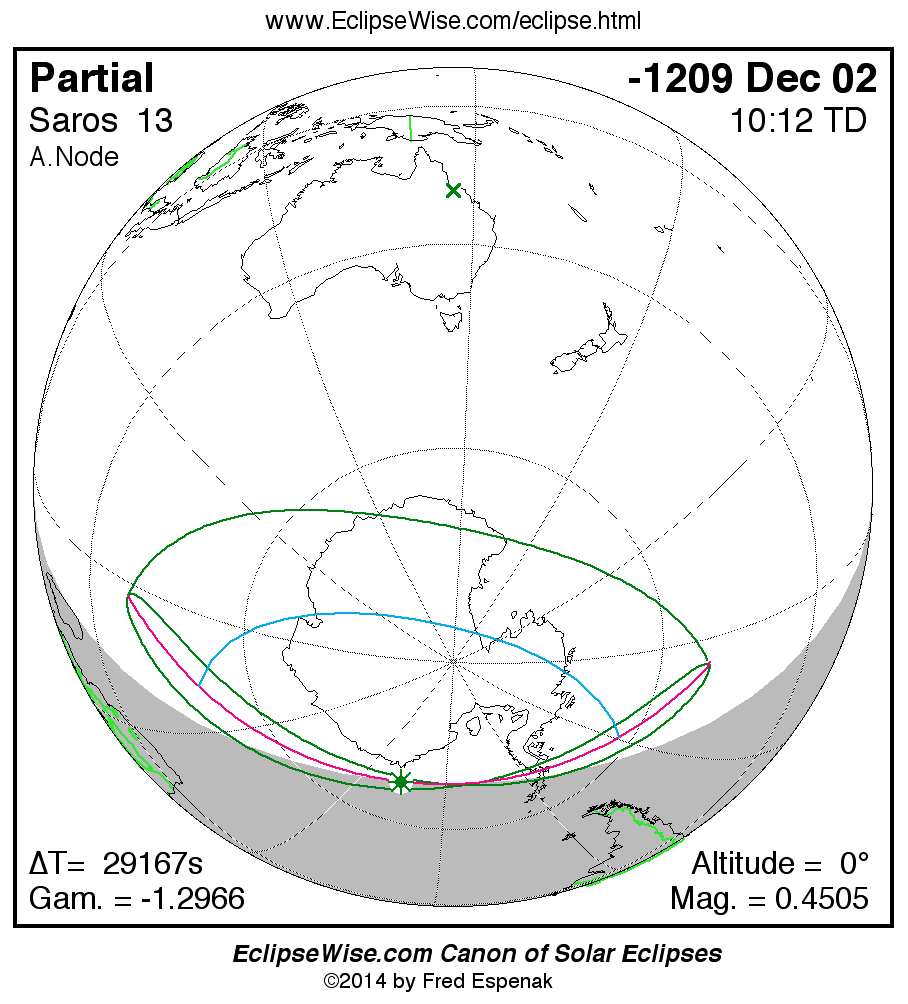
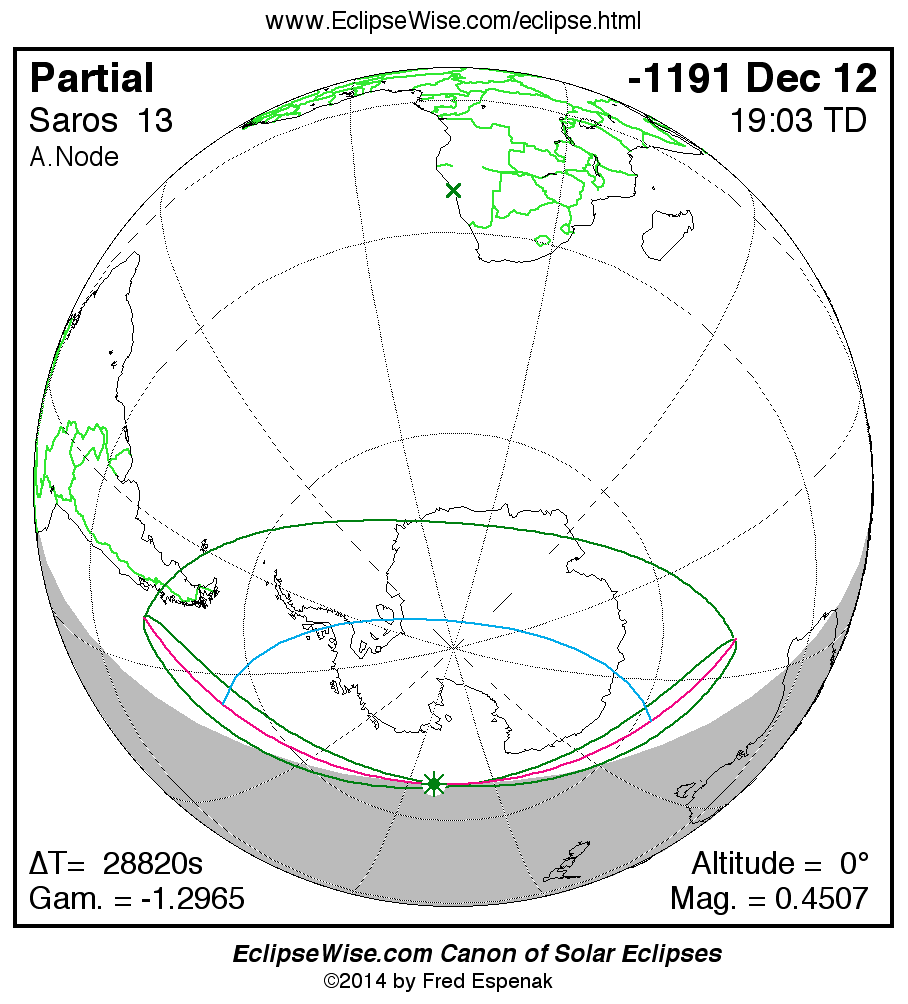
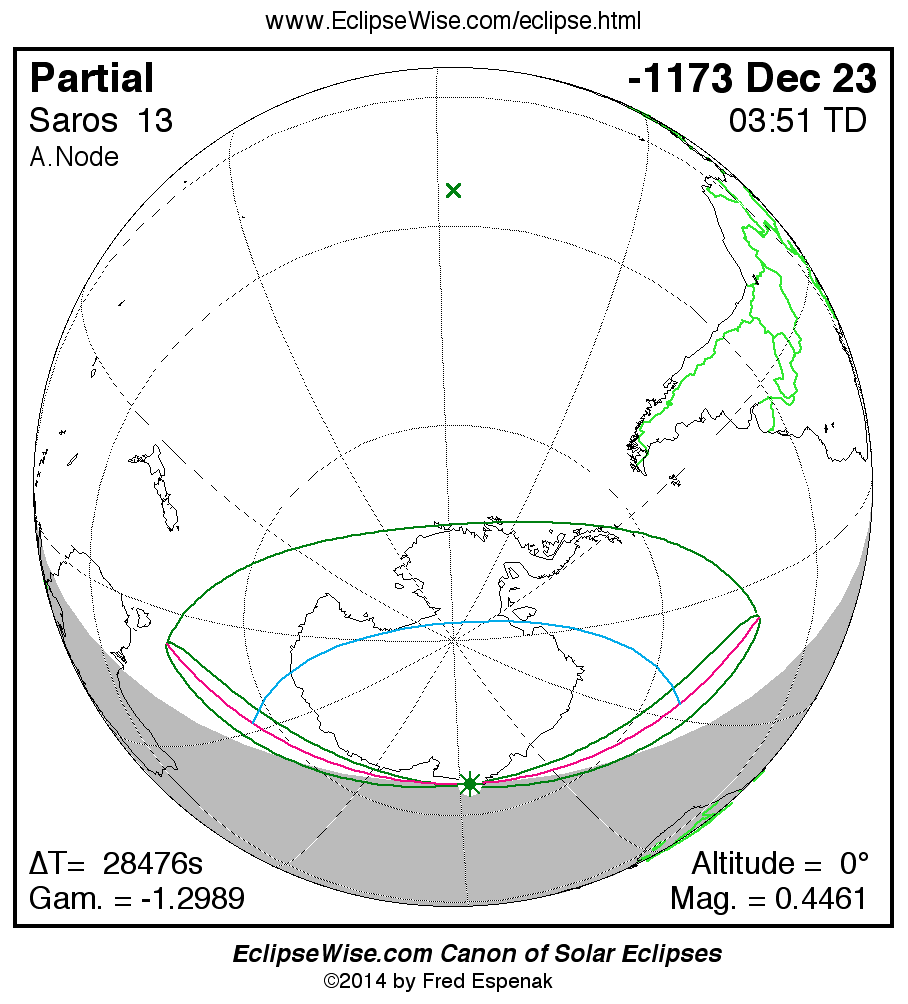
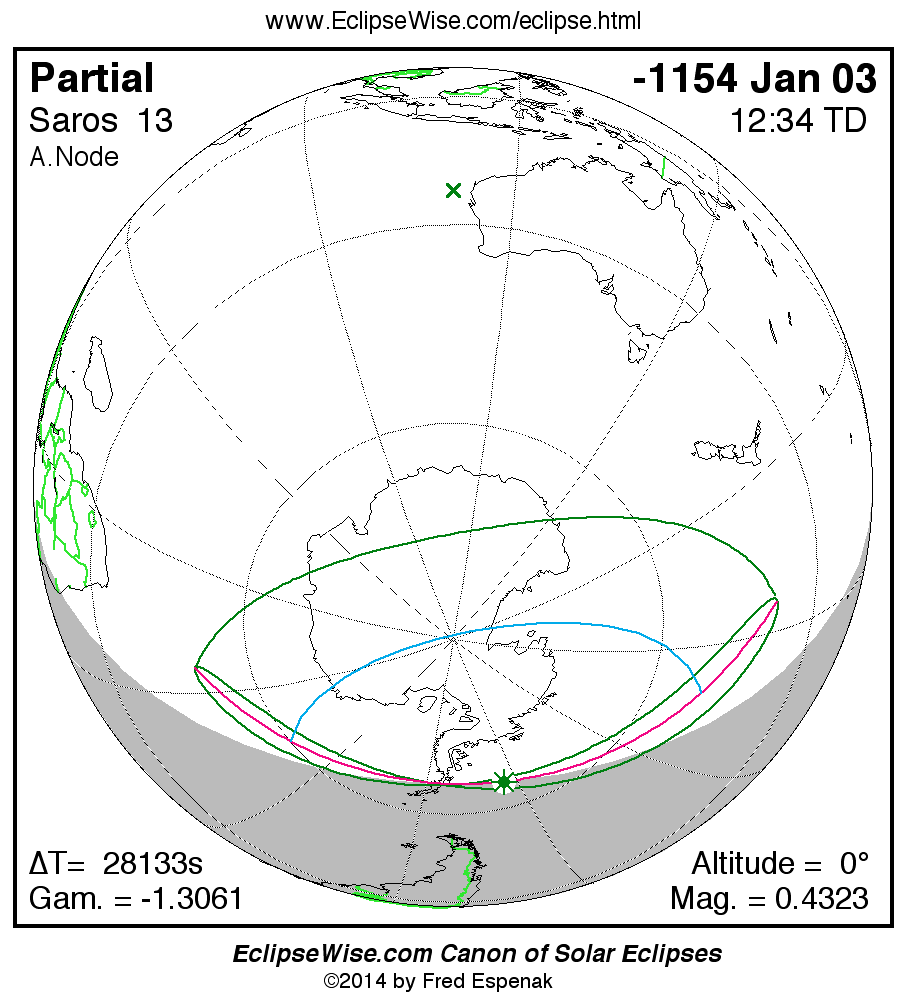
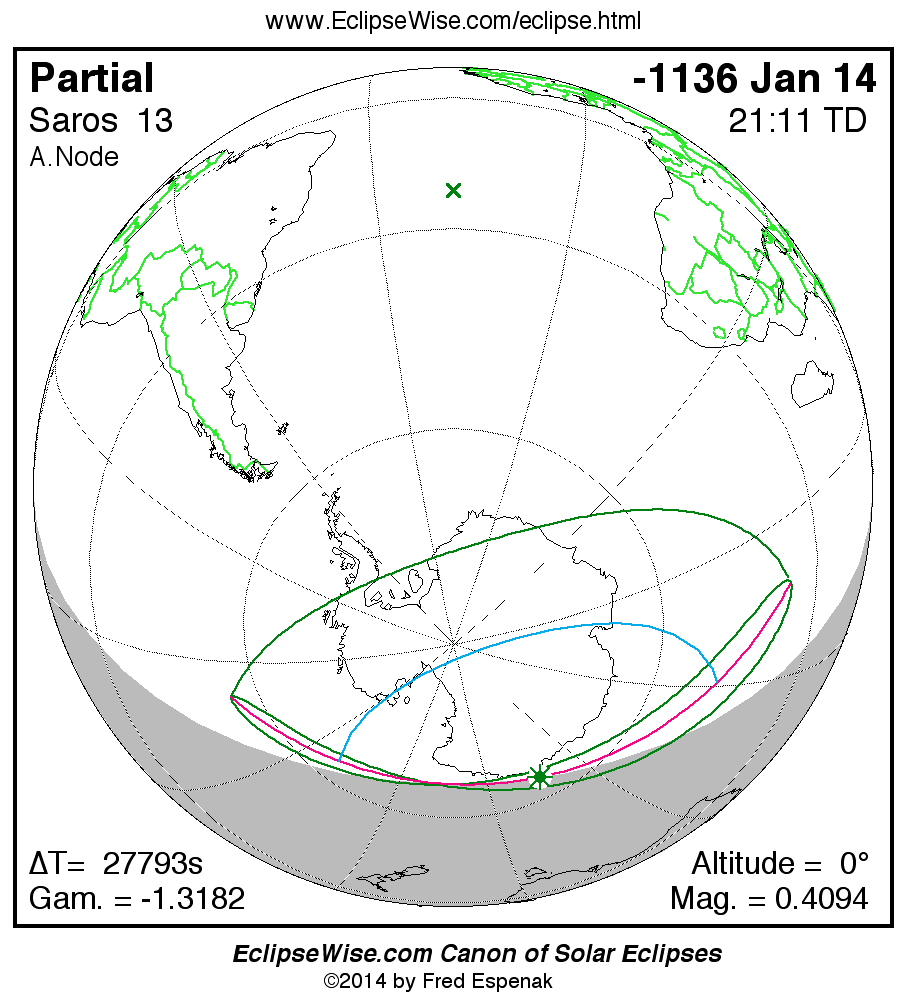
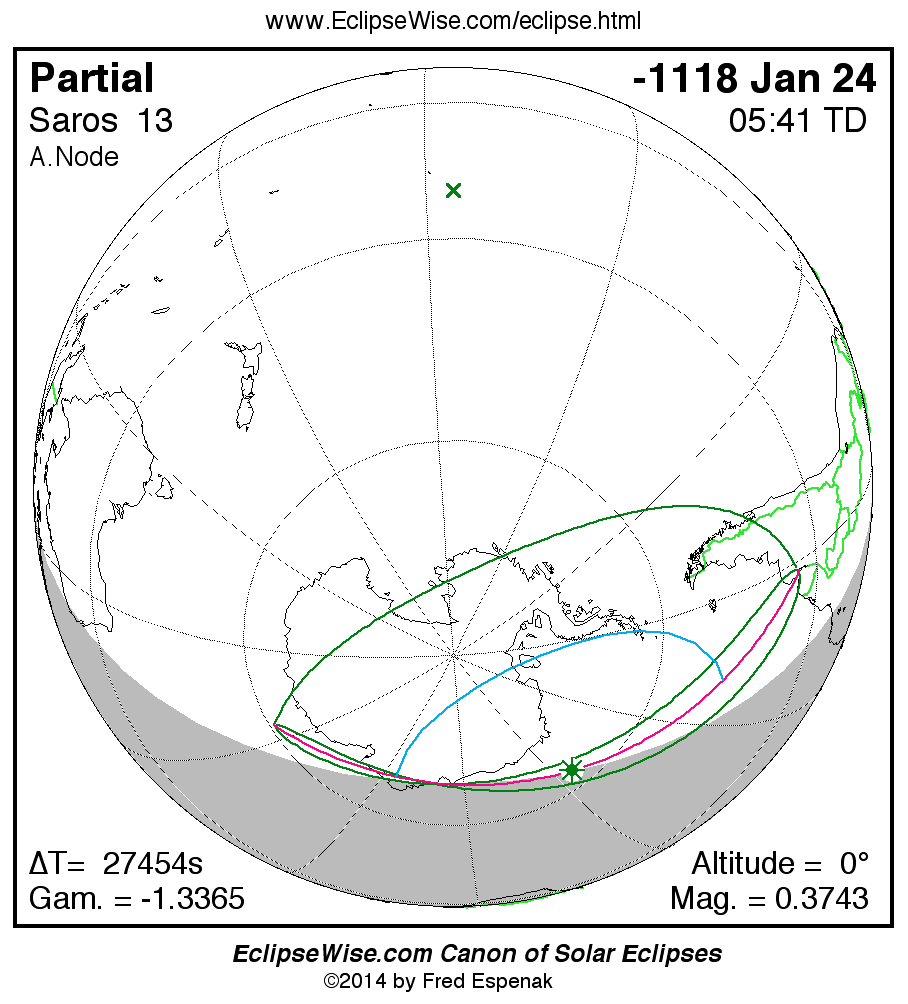
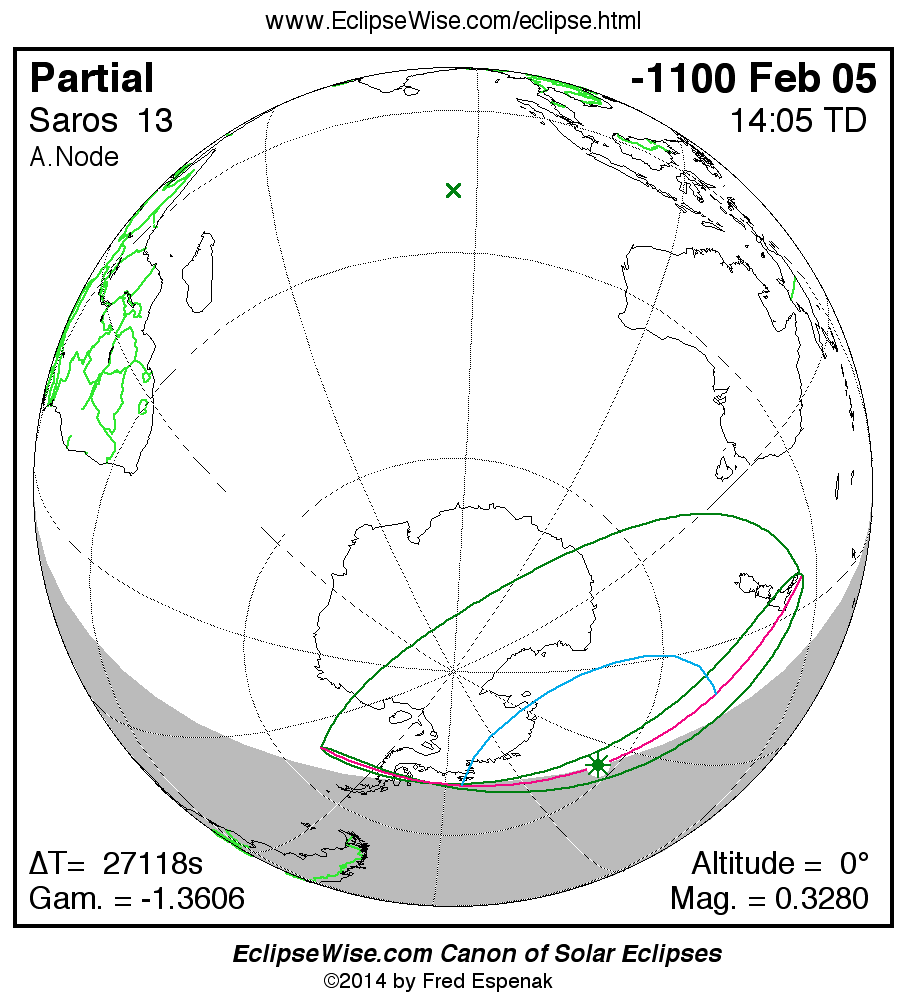
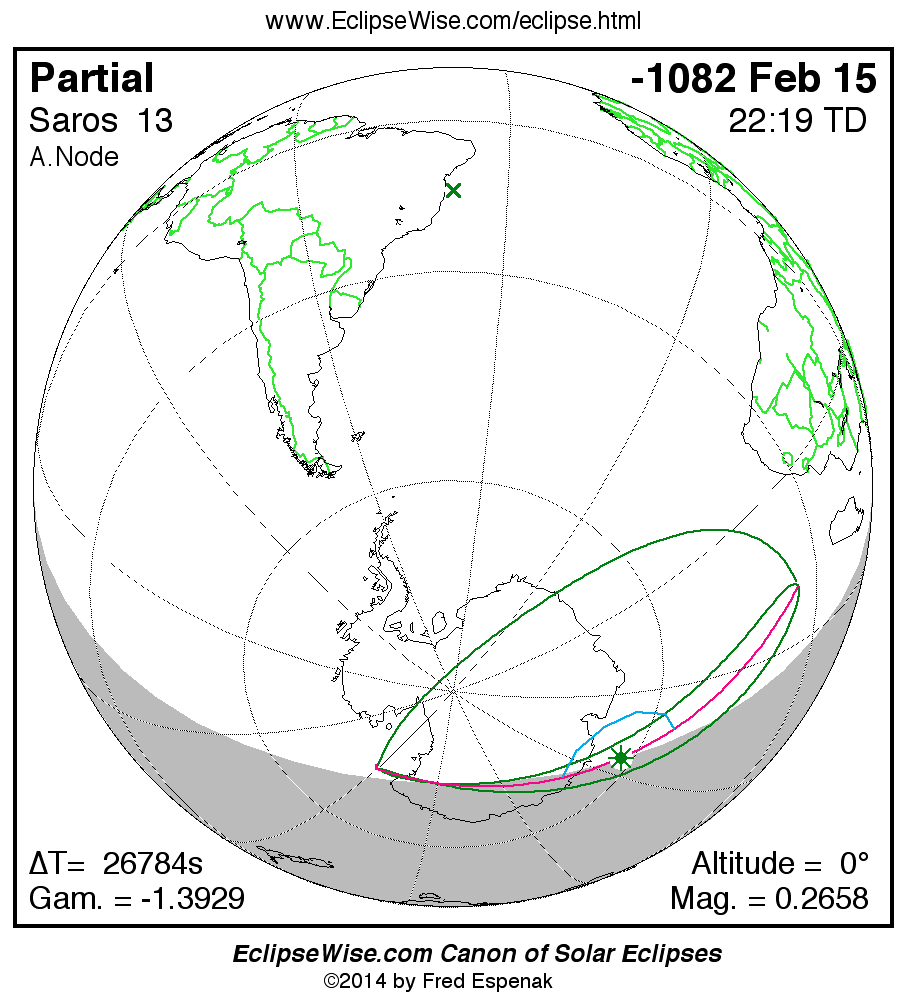
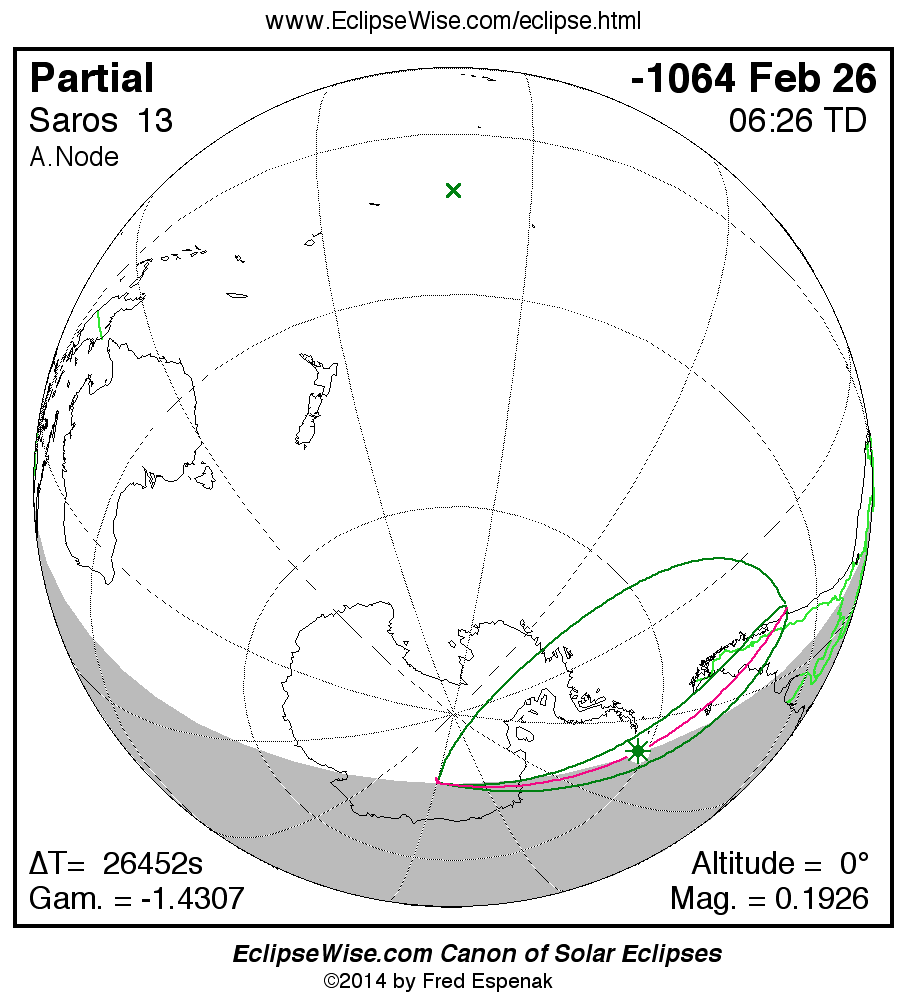
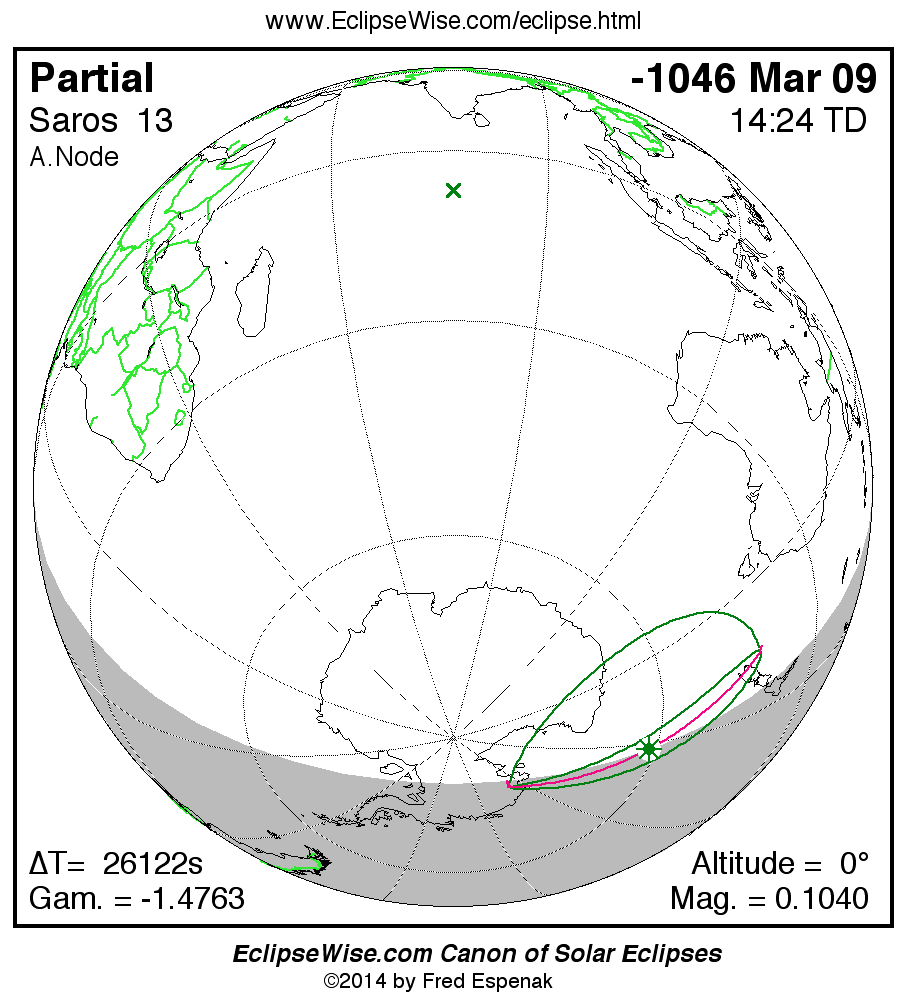
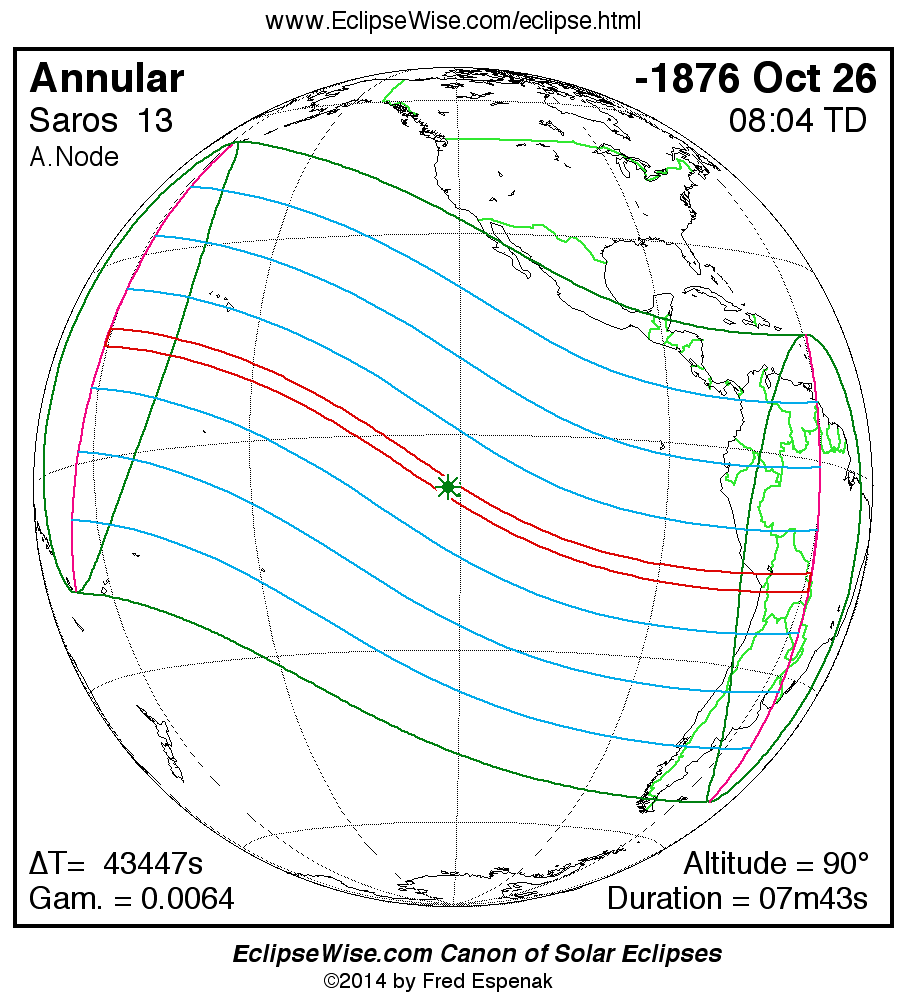
A panorama of all solar eclipses belonging to Saros 13 is presented here. Each map depicts the geographic region of visibility for a single eclipse. For central eclipses, the total or annular path is plotted in either blue (total) or red (annular). The date and time is given for the instant of Greatest Eclipse. Every map serves as a hyperlink to the EclipseWise Prime page for that eclipse where a larger map and complete details for the eclipse can be found. Visit the Key to Solar Eclipse Maps for a detailed explanation of these maps. Near the bottom of the page are a series of hyperlinks for more on solar eclipses.

The exeligmos is a period of three Saros cycles and is equal to approximately 54 years 33 days. Because it is nearly an integral number of days in length, two eclipses separated by 1 exeligmos (= 3 Saroses) not only share all the characterists of a Saros, but also take place in approximately the same geographic location.

The Saros panorama below is arranged in horizontal rows of 3 eclipses. So one eclipse to the left or right is a difference of 1 Saros cycle, and one eclipse above or below is a difference of 1 exeligmos. By scanning a column of the table, it reveals how the geographic visibility of eclipses separated by an exeligmos slowly changes.

  • Click on any global map to go directly to the EclipseWise Prime Page for more information, tables, diagrams and maps. Key to Solar Eclipse Maps explains the features in these maps.
  • Beneath each global eclipse map is a link Google Eclipse Map, that takes you to an interactive Google Map with the eclipse path plotted.

For more information on this series see Statistics for Solar Eclipses of Saros 13 .

Panorama of Solar Eclipses of Saros 13
Partial Solar Eclipse
-2543 Sep 23

Google Eclipse Map
Partial Solar Eclipse
-2525 Oct 04

Google Eclipse Map
Partial Solar Eclipse
-2507 Oct 14

Google Eclipse Map
Partial Solar Eclipse
-2489 Oct 26

Google Eclipse Map
Partial Solar Eclipse
-2471 Nov 05

Google Eclipse Map
Partial Solar Eclipse
-2453 Nov 16

Google Eclipse Map
Partial Solar Eclipse
-2435 Nov 27

Google Eclipse Map
Partial Solar Eclipse
-2417 Dec 08

Google Eclipse Map
Partial Solar Eclipse
-2399 Dec 18

Google Eclipse Map
Partial Solar Eclipse
-2381 Dec 30

Google Eclipse Map
Partial Solar Eclipse
-2362 Jan 09

Google Eclipse Map
Partial Solar Eclipse
-2344 Jan 20

Google Eclipse Map
Partial Solar Eclipse
-2326 Jan 31

Google Eclipse Map
Partial Solar Eclipse
-2308 Feb 11

Google Eclipse Map
Partial Solar Eclipse
-2290 Feb 21

Google Eclipse Map
Partial Solar Eclipse
-2272 Mar 04

Google Eclipse Map
Partial Solar Eclipse
-2254 Mar 15

Google Eclipse Map
Partial Solar Eclipse
-2236 Mar 25

Google Eclipse Map
Partial Solar Eclipse
-2218 Apr 05

Google Eclipse Map
Partial Solar Eclipse
-2200 Apr 16

Google Eclipse Map
Annular Solar Eclipse
-2182 Apr 27

Google Eclipse Map
Annular Solar Eclipse
-2164 May 07

Google Eclipse Map
Annular Solar Eclipse
-2146 May 18

Google Eclipse Map
Annular Solar Eclipse
-2128 May 29

Google Eclipse Map
Annular Solar Eclipse
-2110 Jun 09

Google Eclipse Map
Annular Solar Eclipse
-2092 Jun 19

Google Eclipse Map
Annular Solar Eclipse
-2074 Jun 30

Google Eclipse Map
Annular Solar Eclipse
-2056 Jul 11

Google Eclipse Map
Annular Solar Eclipse
-2038 Jul 22

Google Eclipse Map
Annular Solar Eclipse
-2020 Aug 01

Google Eclipse Map
Annular Solar Eclipse
-2002 Aug 13

Google Eclipse Map
Annular Solar Eclipse
-1984 Aug 23

Google Eclipse Map
Annular Solar Eclipse
-1966 Sep 03

Google Eclipse Map
Annular Solar Eclipse
-1948 Sep 14

Google Eclipse Map
Annular Solar Eclipse
-1930 Sep 25

Google Eclipse Map
Annular Solar Eclipse
-1912 Oct 05

Google Eclipse Map
Annular Solar Eclipse
-1894 Oct 16

Google Eclipse Map
Annular Solar Eclipse
-1876 Oct 27

Google Eclipse Map
Annular Solar Eclipse
-1858 Nov 07

Google Eclipse Map
Annular Solar Eclipse
-1840 Nov 18

Google Eclipse Map
Annular Solar Eclipse
-1822 Nov 29

Google Eclipse Map
Annular Solar Eclipse
-1804 Dec 09

Google Eclipse Map
Annular Solar Eclipse
-1786 Dec 21

Google Eclipse Map
Annular Solar Eclipse
-1768 Dec 31

Google Eclipse Map
Annular Solar Eclipse
-1749 Jan 11

Google Eclipse Map
Annular Solar Eclipse
-1731 Jan 22

Google Eclipse Map
Annular Solar Eclipse
-1713 Feb 02

Google Eclipse Map
Annular Solar Eclipse
-1695 Feb 12

Google Eclipse Map
Annular Solar Eclipse
-1677 Feb 24

Google Eclipse Map
Annular Solar Eclipse
-1659 Mar 06

Google Eclipse Map
Hybrid Solar Eclipse
-1641 Mar 17

Google Eclipse Map
Hybrid Solar Eclipse
-1623 Mar 27

Google Eclipse Map
Hybrid Solar Eclipse
-1605 Apr 08

Google Eclipse Map
Total Solar Eclipse
-1587 Apr 18

Google Eclipse Map
Total Solar Eclipse
-1569 Apr 29

Google Eclipse Map
Total Solar Eclipse
-1551 May 10

Google Eclipse Map
Total Solar Eclipse
-1533 May 21

Google Eclipse Map
Total Solar Eclipse
-1515 May 31

Google Eclipse Map
Total Solar Eclipse
-1497 Jun 11

Google Eclipse Map
Total Solar Eclipse
-1479 Jun 22

Google Eclipse Map
Total Solar Eclipse
-1461 Jul 03

Google Eclipse Map
Partial Solar Eclipse
-1443 Jul 13

Google Eclipse Map
Partial Solar Eclipse
-1425 Jul 25

Google Eclipse Map
Partial Solar Eclipse
-1407 Aug 04

Google Eclipse Map
Partial Solar Eclipse
-1389 Aug 15

Google Eclipse Map
Partial Solar Eclipse
-1371 Aug 26

Google Eclipse Map
Partial Solar Eclipse
-1353 Sep 06

Google Eclipse Map
Partial Solar Eclipse
-1335 Sep 16

Google Eclipse Map
Partial Solar Eclipse
-1317 Sep 28

Google Eclipse Map
Partial Solar Eclipse
-1299 Oct 08

Google Eclipse Map
Partial Solar Eclipse
-1281 Oct 19

Google Eclipse Map
Partial Solar Eclipse
-1263 Oct 30

Google Eclipse Map
Partial Solar Eclipse
-1245 Nov 10

Google Eclipse Map
Partial Solar Eclipse
-1227 Nov 21

Google Eclipse Map
Partial Solar Eclipse
-1209 Dec 02

Google Eclipse Map
Partial Solar Eclipse
-1191 Dec 12

Google Eclipse Map
Partial Solar Eclipse
-1173 Dec 24

Google Eclipse Map
Partial Solar Eclipse
-1154 Jan 03

Google Eclipse Map
Partial Solar Eclipse
-1136 Jan 14

Google Eclipse Map
Partial Solar Eclipse
-1118 Jan 25

Google Eclipse Map
Partial Solar Eclipse
-1100 Feb 05

Google Eclipse Map
Partial Solar Eclipse
-1082 Feb 15

Google Eclipse Map
Partial Solar Eclipse
-1064 Feb 27

Google Eclipse Map
Partial Solar Eclipse
-1046 Mar 09

Google Eclipse Map
Partial Solar Eclipse
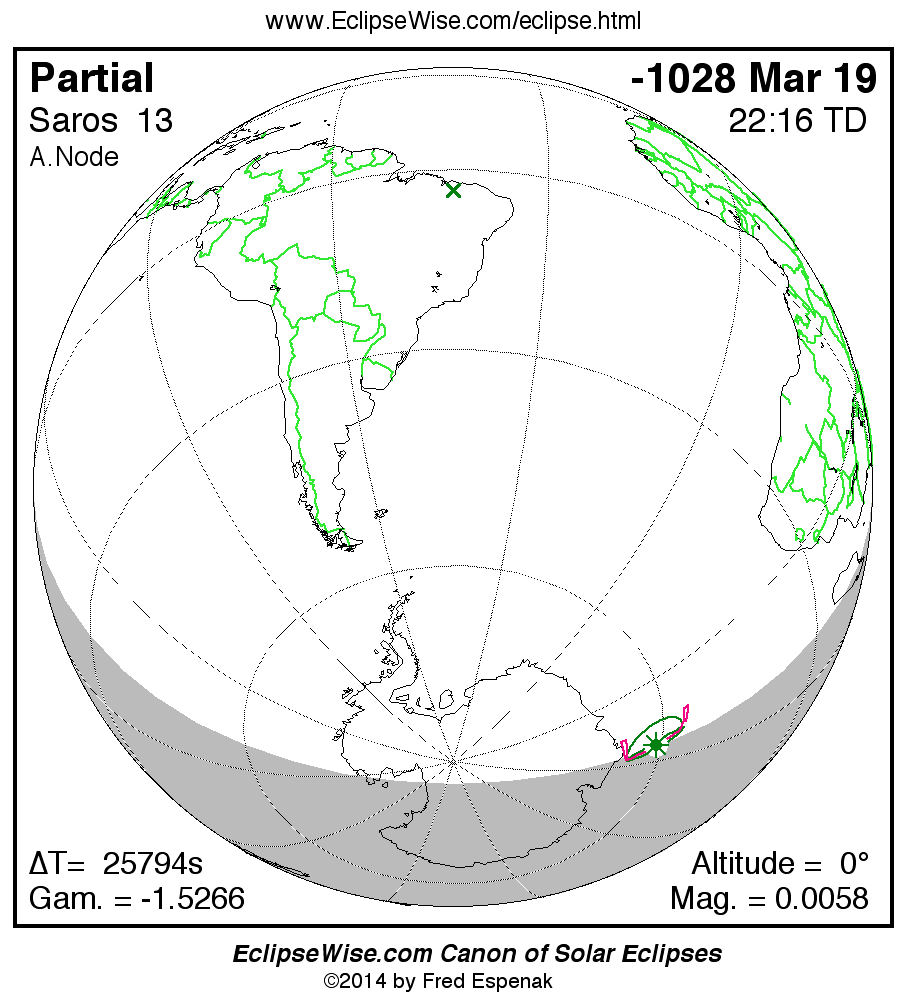
-1028 Mar 19

Google Eclipse Map

Statistics for Solar Eclipses of Saros 13

Solar eclipses of Saros 13 all occur at the Moon’s ascending node and the Moon moves southward with each eclipse. The series began with a partial eclipse in the northern hemisphere on -2543 Sep 23. The series ended with a partial eclipse in the southern hemisphere on -1028 Mar 19. The total duration of Saros series 13 is 1514.53 years.
Summary of Saros 13
First Eclipse -2543 Sep 23
Last Eclipse -1028 Mar 19
Series Duration 1514.53 Years
No. of Eclipses 85
Sequence 20P 30A 3H 8T 24P

Saros 13 is composed of 85 solar eclipses as follows:

Solar Eclipses of Saros 13
Eclipse Type Symbol Number Percent
All Eclipses - 85100.0%
PartialP 44 51.8%
AnnularA 30 35.3%
TotalT 8 9.4%
HybridH 3 3.5%

Umbral eclipses (annular, total and hybrid) can be further classified as either: 1) Central (two limits), 2) Central (one limit) or 3) Non-Central (one limit). The statistical distribution of these classes in Saros series 13 appears in the following table.

Umbral Eclipses of Saros 13
Classification Number Percent
All Umbral Eclipses 41100.0%
Central (two limits) 40 97.6%
Central (one limit) 1 2.4%
Non-Central (one limit) 0 0.0%

The 85 eclipses in Saros 13 occur in the following order : 20P 30A 3H 8T 24P

The longest and shortest central eclipses of Saros 13 as well as largest and smallest partial eclipses appear below.

Extreme Durations and Magnitudes of Solar Eclipses of Saros 13
Extrema Type Date Duration Magnitude
Longest Annular Solar Eclipse -1912 Oct 0507m55s -
Shortest Annular Solar Eclipse -1659 Mar 0600m34s -
Longest Total Solar Eclipse -1515 May 3102m35s -
Shortest Total Solar Eclipse -1587 Apr 1801m29s -
Longest Hybrid Solar Eclipse -1605 Apr 0801m03s -
Shortest Hybrid Solar Eclipse -1641 Mar 1700m01s -
Largest Partial Solar Eclipse -2200 Apr 16 - 0.92594
Smallest Partial Solar Eclipse -1028 Mar 19 - 0.00590

Eclipse Publications

by Fred Espenak

jpeg jpeg
jpeg jpeg
jpeg jpeg

Calendar

The Gregorian calendar (also called the Western calendar) is internationally the most widely used civil calendar. It is named for Pope Gregory XIII, who introduced it in 1582. On this website, the Gregorian calendar is used for all calendar dates from 1582 Oct 15 onwards. Before that date, the Julian calendar is used. For more information on this topic, see Calendar Dates.

The Julian calendar does not include the year 0. Thus the year 1 BCE is followed by the year 1 CE (See: BCE/CE Dating Conventions). This is awkward for arithmetic calculations. Years in this catalog are numbered astronomically and include the year 0. Historians should note there is a difference of one year between astronomical dates and BCE dates. Thus, the astronomical year 0 corresponds to 1 BCE, and astronomical year -1 corresponds to 2 BCE, etc..

Eclipse Predictions

The eclipse predictions presented here were generated using the JPL DE406 solar and lunar ephemerides. The lunar coordinates have been calculated with respect to the Moon's Center of Mass.

The largest uncertainty in the eclipse predictions is caused by fluctuations in Earth's rotation due primarily to tidal friction of the Moon. The resultant drift in apparent clock time is expressed as ΔT and is determined as follows:

  1. pre-1950's: ΔT calculated from empirical fits to historical records derived by Morrison and Stephenson (2004)
  2. 1955-present: ΔT obtained from published observations
  3. future: ΔT is extrapolated from current values weighted by the long term trend from tidal effects

A series of polynomial expressions have been derived to simplify the evaluation of ΔT for any time from -2999 to +3000. The uncertainty in ΔT over this period can be estimated from scatter in the measurements.

Acknowledgments

Some of the content on this web site is based on the books Five Millennium Canon of Solar Eclipses: -1999 to +3000 and Thousand Year Canon of Solar Eclipses 1501 to 2500. All eclipse calculations are by Fred Espenak, and he assumes full responsibility for their accuracy.

Permission is granted to reproduce eclipse data when accompanied by a link to this page and an acknowledgment:

"Eclipse Predictions by Fred Espenak, www.EclipseWise.com"

The use of diagrams and maps is permitted provided that they are NOT altered (except for re-sizing) and the embedded credit line is NOT removed or covered.